Exam 17: Process Improvement Using Control Charts
Exam 1: An Introduction to Business Statistics54 Questions
Exam 2: Descriptive Statistics: Tabular and Graphical Methods90 Questions
Exam 3: Descriptive Statistics: Numerical Methods149 Questions
Exam 4: Probability135 Questions
Exam 5: Discrete Random Variables128 Questions
Exam 6: Continuous Random Variables150 Questions
Exam 7: Sampling and Sampling Distributions116 Questions
Exam 8: Confidence Intervals144 Questions
Exam 9: Hypothesis Testing148 Questions
Exam 10: Statistical Inferences Based on Two Samples132 Questions
Exam 11: Experimental Design and Analysis of Variance115 Questions
Exam 12: Chi-Square Tests96 Questions
Exam 13: Simple Linear Regression Analysis148 Questions
Exam 14: Multiple Regression122 Questions
Exam 15: Model Building and Model Diagnostics102 Questions
Exam 16: Time Series Forecasting150 Questions
Exam 17: Process Improvement Using Control Charts122 Questions
Exam 18: Nonparametric Methods97 Questions
Exam 19: Decision Theory90 Questions
Select questions type
The number of estimated process standard deviations between  and the closest specification limit is the ______ of the process.
Free
(Multiple Choice)
4.9/5  (33)
(33)
Correct Answer: Verified
A
The quality of an electronic component used in manufacturing cell phones is monitored with a p-chart.In the last 20 days daily samples of 75 units resulted in the following number of defective units per sample: 8,4,3,7,3,1,0,7,4,2,0,1,6,2,4,3,1,2,8,5
If on the 21st day,9 defective units were found in the sample of 75 units,would the process be in control?
Free
(Multiple Choice)
4.8/5 (35)
Correct Answer:Verified
A
Rational subgrouping allows us to detect changes _____ subgroups.
Free
(Multiple Choice)
4.8/5 (33)
Correct Answer:Verified
B
How well a product or a service performs in the market place is called the quality of ______________.
(Multiple Choice)
4.8/5 (28)
How well the design of the product meets and exceeds the needs and expectations of the customers is called the quality of performance.
(True/False)
4.8/5 (31)
A manufacturer of windows produces one type that has a plastic coating.The specification limits for the plastic coating are 30 and 70.From time to time the plastic coating can become uneven.Therefore,in order to keep the coating as even as possible,thickness measurements are periodically taken at four different locations on the window.15 subgroups were observed and each subgroup consists of the four thickness measurements taken across the windows at a particular time with the following results: mean of the means =  = 50.05 and the average range of 8.85. Assuming that the process is in statistical control,calculate the natural tolerance limits for the process.
(Multiple Choice)
4.9/5 (34)
If  = 2.0144,
  = .0972,and 25 subgroups of size 5. Find the UCL and the LCL for the
  chart.
(Multiple Choice)
4.8/5 (34)
If a process is only influenced by common causes of variation,we can state that the process is in statistical control.
(True/False)
4.8/5 (40)
A manufacturer of windows produces one type that has a plastic coating.The specification limits for the plastic coating are 30 and 70.From time to time the plastic coating can become uneven.Therefore,in order to keep the coating as even as possible,thickness measurements are periodically taken at four different locations on the window.15 subgroups were observed and each subgroup consists of the four thickness measurements taken across the windows at a particular time with the following results: mean of the means =  = 50.05 and the average range of 8.85. Calculate the center line for the X-bar chart.
(Multiple Choice)
4.9/5 (40)
A fastener company produces bolts with a nominal (target)length of 2.00 inches.The specifications are 2.00 .006 inches. Determine the upper specification limit and the lower specification limit for this process.
(Multiple Choice)
4.9/5 (44)
How well the design of a product or service meets and exceeds the needs and expectations of the customer is called
(Multiple Choice)
4.8/5 (40)
If  = 5.2,
  = .3,and n = 4,calculate natural tolerance limits.
(Multiple Choice)
4.9/5 (42)
A bank officer wishes to study how many customers write bad checks.To accomplish this,the officer randomly selects a weekly sample of 100 of checking accounts,and the number of who wrote bad checks was recorded.The numbers of customers who wrote bad checks in 20 consecutive weekly samples of 100 cardholders are,respectively, 1,4,9,0,4,6,0,3,8,5,3,5,2,9,4,4,3,6,4,0
Find the appropriate center line.
(Multiple Choice)
4.8/5 (35)
If 20 samples of size 7 are drawn with  = 33.33 and
  = 5.65, What is the A-B upper boundary for the
  chart?
(Multiple Choice)
4.9/5 (44)
A motorcycle manufacturer produces the parts for its vehicles in different locations and transports them to it plant for assembly.In order to keep the assembly operations running efficiently,it is vital that all parts be within specification limits.One important part used in the assembly is the engine camshaft and one important quality characteristic is the case hardness depth.Specifications state that the hardness depth must be between 3.0 mm and 6.0 mm.To investigate the process,the quality control engineer selected 25 daily subgroups of n = 5 and measured the hardness depth.The process yielded a mean of the means  = 4.50 and an average range = 1.01. Assuming that the process is in statistical control,calculate the natural tolerance limits for the process.
(Multiple Choice)
4.8/5 (40)
A systematic method for analyzing process data in which we monitor process variation is called _____.
(Multiple Choice)
4.8/5 (32)
A foreman wants to use an  chart to control the average length of the bolts manufactured.He has recently collected the six samples given below.
 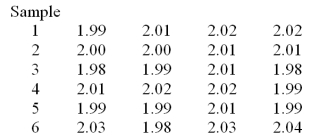 Determine the LCL and the UCL for the
  chart.
(Multiple Choice)
4.7/5 (37)
Which one of the following control charts is designed to control the proportion of nonconforming units?
(Multiple Choice)
4.9/5 (25)
Filters
- Essay(0)
- Multiple Choice(0)
- Short Answer(0)
- True False(0)
- Matching(0)