Exam 3: Descriptive Statistics: Numerical Methods
Exam 1: An Introduction to Business Statistics54 Questions
Exam 2: Descriptive Statistics: Tabular and Graphical Methods90 Questions
Exam 3: Descriptive Statistics: Numerical Methods149 Questions
Exam 4: Probability135 Questions
Exam 5: Discrete Random Variables128 Questions
Exam 6: Continuous Random Variables150 Questions
Exam 7: Sampling and Sampling Distributions116 Questions
Exam 8: Confidence Intervals144 Questions
Exam 9: Hypothesis Testing148 Questions
Exam 10: Statistical Inferences Based on Two Samples132 Questions
Exam 11: Experimental Design and Analysis of Variance115 Questions
Exam 12: Chi-Square Tests96 Questions
Exam 13: Simple Linear Regression Analysis148 Questions
Exam 14: Multiple Regression122 Questions
Exam 15: Model Building and Model Diagnostics102 Questions
Exam 16: Time Series Forecasting150 Questions
Exam 17: Process Improvement Using Control Charts122 Questions
Exam 18: Nonparametric Methods97 Questions
Exam 19: Decision Theory90 Questions
Select questions type
In a given data set the 25th percentile is _______________ equal the lower hinge.
Free
(Multiple Choice)
4.8/5  (28)
(28)
Correct Answer: Verified
B
In a hearing test,subjects estimate the loudness (in decibels)of sound,and the results are;68,67,70,71,68,75,68,62,80,73,68 What is the IQR?
Free
(Multiple Choice)
4.9/5 (44)
Correct Answer:Verified
C
Quality control is an important issue at ACME Company which manufactures light bulbs.In order to conduct testing of the life hours of their light bulbs,they randomly sampled nine light bulbs and measured how many hours they lasted.378,361,350,375,200,391,375,368,321 What are the outer fences?
Free
(Multiple Choice)
4.9/5 (33)
Correct Answer:Verified
B
Quality control is an important issue at ACME Company which manufactures light bulbs.In order to conduct testing of the life hours of their light bulbs,they randomly sampled nine light bulbs and measured how many hours they lasted.378,361,350,375,200,391,375,368,321 What is the 65th percentile?
(Multiple Choice)
4.8/5 (36)
The local amusement park was interested in the average wait time at their most popular roller coaster at the peak park time (2 p.m. ).They selected 13 patrons and had them get in line between 2 and 3 p.m.Each was given a stop watch to record the time they spent in line.The times recorded were as follows (in minutes)(mean = 114.15): 118,124,108,116,99,120,148,118,119,121,45,130,118 What is the variance?
(Multiple Choice)
4.7/5 (43)
In a statistic class,10 scores were randomly selected with the following results were obtained: 74,73,77,77,71,68,65,77,67,66 What is the 65th percentile?
(Multiple Choice)
4.8/5 (39)
In a statistic class,10 scores were randomly selected with the following results were obtained: 74,73,77,77,71,68,65,77,67,66 What is the third quartile?
(Multiple Choice)
4.7/5 (33)
In a hearing test,subjects estimate the loudness (in decibels)of sound,and the results are (mean = 70): 68,67,70,71,68,75,68,62,80,73,68 What is the standard deviation?
(Multiple Choice)
4.7/5 (33)
If one intends to compare the relative variation between two samples involving two different quantitative variables with different measurement scales,then the most appropriate way is to compare the two samples:
(Multiple Choice)
4.8/5 (42)
If the mean,median,and mode for a given population all equal 25,then we Know that its distribution is
(Multiple Choice)
4.7/5 (43)
The company financial officer was interested in the average cost of PCs that had been purchased in the past six months.A random sample of the price of 10 computers was taken with the following results (mean = $3,213): $3,250,$1,127,$2,995,$3,250,$3,445,$3,449,$1,482,$6,120,$3,009,$4,000 What is the standard deviation?
(Multiple Choice)
4.9/5 (32)
The average life of Canadian women is 73.75 years and the standard deviation of the women's life expectancy in Canada is 6.5 years. Based on Chebyshev's inequality determine the upper and lower bounds on the average life expectancy of the Canadian women such that at least 90% of all population is included.
(Multiple Choice)
4.9/5 (40)
In a statistic class,10 scores were randomly selected with the following results were obtained: 74,73,77,77,71,68,65,77,67,66 What is the median?
(Multiple Choice)
4.7/5 (44)
In a study of the factors that affect success in economics,data were collected for 8 business students.Scores on a calculus placement test are given with economics final exam scores.The data are below: 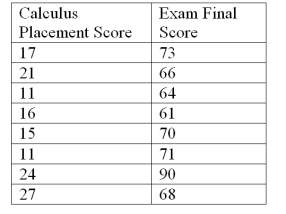 It can be shown that for these data:
  = 17.75,
  = 70.38,
  2 = 237.50,
  2 = 545.875,
 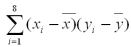 = 140.75 Calculate the sample covariance.
(Multiple Choice)
4.7/5 (35)
In a survey of 550 randomly-selected college statistic students were surveyed on their impressions of their course,instructor and textbook.The results are as follows: 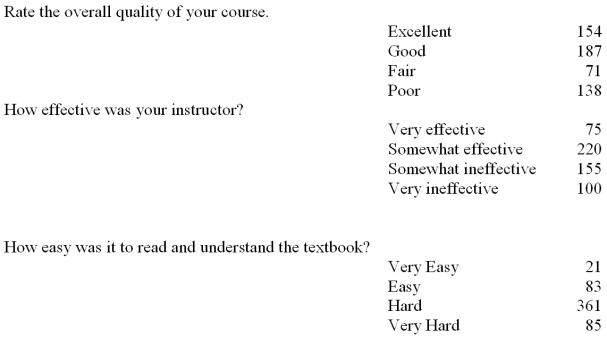 Compute a point estimate of the proportion of all college statistic students who think their instructor was "very effective"
(Multiple Choice)
4.8/5 (40)
As a measure of variation,the sample _________ is easy to understand and compute.It is based on the two extreme values and is therefore a highly unstable measure.
(Multiple Choice)
4.8/5 (38)
The local amusement park was interested in the average wait time at their most popular roller coaster at the peak park time (2 p.m. ).They selected 13 patrons and had them get in line between 2 and 3 p.m.Each was given a stop watch to record the time they spent in line.The times recorded were as follows (in minutes)118,124,108,116,99,120,148,118,119,121,45,130,118 What is the first quartile?
(Multiple Choice)
4.9/5 (24)
The range of the measurement is the largest measurement plus the small measurement.
(True/False)
4.8/5 (33)
In a study of employee stock ownership plans,data was collected at seven companies on satisfaction with the plan and the amount of organization commitment. 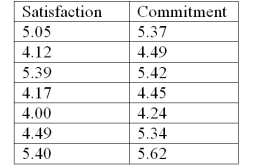 It can be shown that for these data:
 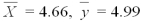 ,
, 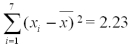 ,
,
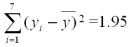 ,
, 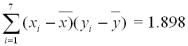 Calculate the sample covariance.
(Multiple Choice)
4.9/5 (29)
All of the following are measures of central tendency except the
(Multiple Choice)
4.8/5 (32)
Filters
- Essay(0)
- Multiple Choice(0)
- Short Answer(0)
- True False(0)
- Matching(0)