Exam 3: Descriptive Statistics: Numerical Methods
Exam 1: An Introduction to Business Statistics54 Questions
Exam 2: Descriptive Statistics: Tabular and Graphical Methods90 Questions
Exam 3: Descriptive Statistics: Numerical Methods149 Questions
Exam 4: Probability135 Questions
Exam 5: Discrete Random Variables128 Questions
Exam 6: Continuous Random Variables150 Questions
Exam 7: Sampling and Sampling Distributions116 Questions
Exam 8: Confidence Intervals144 Questions
Exam 9: Hypothesis Testing148 Questions
Exam 10: Statistical Inferences Based on Two Samples132 Questions
Exam 11: Experimental Design and Analysis of Variance115 Questions
Exam 12: Chi-Square Tests96 Questions
Exam 13: Simple Linear Regression Analysis148 Questions
Exam 14: Multiple Regression122 Questions
Exam 15: Model Building and Model Diagnostics102 Questions
Exam 16: Time Series Forecasting150 Questions
Exam 17: Process Improvement Using Control Charts122 Questions
Exam 18: Nonparametric Methods97 Questions
Exam 19: Decision Theory90 Questions
Select questions type
Researchers wish to study fuel consumption rates based on speed.The data from 10 cars is below: 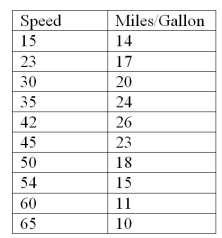 It can be shown that for these data:
  = 41.9,
  = 17.8,
  2 = 2352.9,
  2 = 267.6,
 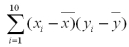 = -270.2 Calculate the sample covariance.
(Multiple Choice)
4.8/5  (35)
(35)
The local amusement park was interested in the average wait time at their most popular roller coaster at the peak park time (2 p.m. ).They selected 13 patrons and had them get in line between 2 and 3 p.m.Each was given a stop watch to record the time they spent in line.The times recorded were as follows (in minutes): 118,124,108,116,99,120,148,118,119,121,45,130,118 What is the mode?
(Multiple Choice)
4.7/5 (39)
If the mean is greater than the median,then the distribution is _____.
(Multiple Choice)
4.8/5 (29)
550 students answered a question with the following results based on their rating of their instructor: 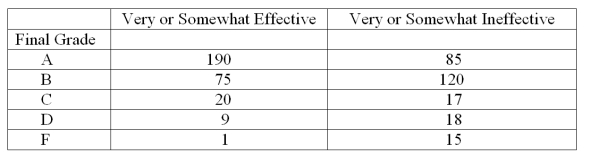 What proportion of the students who rated their instructor as very or somewhat effective received a B or better in the class?
(Multiple Choice)
4.8/5 (30)
The local amusement park was interested in the average wait time at their most popular roller coaster at the peak park time (2 p.m. ).They selected 13 patrons and had them get in line between 2 and 3 p.m.Each was given a stop watch to record the time they spent in line.The times recorded were as follows (in minutes): 118,124,108,116,99,120,148,118,119,121,45,130,118 What is the median?
(Multiple Choice)
4.9/5 (34)
Quality control is an important issue at ACME Company which manufactures light bulbs.In order to conduct testing of the life hours of their light bulbs,they randomly sampled nine light bulbs and measured how many hours they lasted.378,361,350,375,200,391,375,368,321 What is the mode?
(Multiple Choice)
4.9/5 (30)
If a population distribution is skewed to the right,then,given a random sample from that population,one would expect that the
(Multiple Choice)
4.9/5 (39)
Quality control is an important issue at ACME Company which manufactures light bulbs.In order to conduct testing of the life hours of their light bulbs,they randomly sampled nine light bulbs and measured how many hours they lasted.378,361,350,375,200,391,375,368,321 What is the first quartile?
(Multiple Choice)
5.0/5 (27)
In a hearing test,subjects estimate the loudness (in decibels)of sound,and the results are;68,67,70,71,68,75,68,62,80,73,68 What is the 10th percentile?
(Multiple Choice)
4.9/5 (32)
The median is the value below which and above which approximately 50 percent of the measurements lie.
(True/False)
4.9/5 (34)
The company financial officer was interested in the average cost of PCs that had been purchased in the past six months.A random sample of the price of 10 computers was taken with the following results;$3,250,$1,127,$2,995,$3,250,$3,445,$3,449,$1,482,$6,120,$3,009,$4,000 What is the 90th percentile?
(Multiple Choice)
4.8/5 (33)
If there are 7 classes in a frequency distribution then the fourth class will always contain the median.
(True/False)
4.9/5 (34)
Quality control is an important issue at ACME company which manufactures light bulbs.In order to conduct testing of the life hours of their light bulbs,they randomly sampled nine light bulbs and measured how many hours they lasted.378,361,350,375,200,391,375,368,321 What is the 90th percentile?
(Multiple Choice)
4.8/5 (34)
The following table shows the Price-to-Earnings ratio for a Stereo equipment manufacturing company between 1998 and 2002. 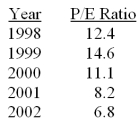 Determine the percentage change in the P/E ratios from 1998 to 1999.
(Multiple Choice)
4.9/5 (30)
In a study of the factors that affect success in economics,data were collected for 8 business students.Scores on a calculus placement test are given with economics final exam scores.The data are below: 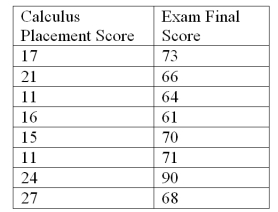 It can be shown that for these data:
  = 17.75,
  = 70.38,
  = 237.50,
  = 545.875,
 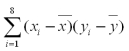 = 140.75 Calculate the sample correlation coefficient.
(Multiple Choice)
4.9/5 (23)
In a statistic class,10 scores were randomly selected with the following results were obtained: 74,73,77,77,71,68,65,77,67,66 What is the 90th percentile?
(Multiple Choice)
4.8/5 (37)
In a hearing test,subjects estimate the loudness (in decibels)of sound,and the results are (mean = 70): 68,67,70,71,68,75,68,62,80,73,68 What is the variance?
(Multiple Choice)
4.7/5 (28)
Find the coefficient of variation for IQ tests with a mean of 100 and a standard deviation of 15.
(Multiple Choice)
4.9/5 (39)
Filters
- Essay(0)
- Multiple Choice(0)
- Short Answer(0)
- True False(0)
- Matching(0)