Exam 4: Integrals
Exam 1: Functions and Limits117 Questions
Exam 2: Derivatives151 Questions
Exam 3: Applications of Differentiation153 Questions
Exam 4: Integrals95 Questions
Exam 5: Applications of Integration120 Questions
Exam 6: Inverse Functions127 Questions
Exam 7: Techniques of Integration124 Questions
Exam 8: Further Applications of Integration86 Questions
Exam 9: Differential Equations67 Questions
Exam 10: Parametric Equations and Polar Coordinates72 Questions
Exam 11: Infinite Sequences and Series158 Questions
Exam 12: Vectors and the Geometry of Space60 Questions
Exam 13: Vector Functions93 Questions
Exam 14: Partial Derivatives132 Questions
Exam 15: Multiple Integrals124 Questions
Exam 16: Vector Calculus137 Questions
Exam 17: Second-Order Differential Equations63 Questions
Exam 18: Final Exam44 Questions
Select questions type
Use the given graph of  to find the Riemann sum with six subintervals. Take the sample points to be left endpoints.
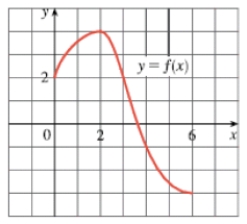
(Multiple Choice)
4.9/5  (31)
(31)
Evaluate the Riemann sum for 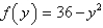 ,
,  with four subintervals, taking the sample points to be right endpoints.
(Essay)
4.8/5 (34)
An animal population is increasing at a rate of  per year (where t is measured in years). By how much does the animal population increase between the fourth and tenth years?
(Multiple Choice)
4.7/5 (30)
Find the area of the region that lies under the given curve. Round the answer to three decimal places. 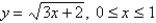
(Multiple Choice)
4.8/5 (33)
Find an expression for the area under the graph of  as a limit. Do not evaluate the limit.
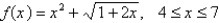
(Essay)
4.8/5 (41)
Use the Midpoint Rule with n = 10 to approximate the integral. 
(Multiple Choice)
4.9/5 (38)
Find the area of the region to three decimal places that lies under the given curve. 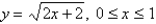
(Multiple Choice)
4.8/5 (30)
Find the area of the region that lies to the right of the y-axis and to the left of the parabola  .
.
(Essay)
4.9/5 (42)
Evaluate the integral by interpreting it in terms of areas. 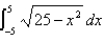
(Multiple Choice)
4.9/5 (37)
The graph of a function f on the interval [0, 8] is shown in the figure. Compute the Riemann sum for f on [0, 8] using four subintervals of equal length and choosing the evaluation points to be (a) the left endpoints, (b) the right endpoints, and (c) the midpoints of the subintervals. ![The graph of a function f on the interval [0, 8] is shown in the figure. Compute the Riemann sum for f on [0, 8] using four subintervals of equal length and choosing the evaluation points to be (a) the left endpoints, (b) the right endpoints, and (c) the midpoints of the subintervals.](https://storage.examlex.com/TB5971/11eaa3e5_55ad_e759_9f8f_c76368df6664_TB5971_00.jpg)
(Essay)
4.8/5 (44)
Filters
- Essay(0)
- Multiple Choice(0)
- Short Answer(0)
- True False(0)
- Matching(0)