Exam 1: Functions and Limits
Exam 1: Functions and Limits117 Questions
Exam 2: Derivatives151 Questions
Exam 3: Applications of Differentiation153 Questions
Exam 4: Integrals95 Questions
Exam 5: Applications of Integration120 Questions
Exam 6: Inverse Functions127 Questions
Exam 7: Techniques of Integration124 Questions
Exam 8: Further Applications of Integration86 Questions
Exam 9: Differential Equations67 Questions
Exam 10: Parametric Equations and Polar Coordinates72 Questions
Exam 11: Infinite Sequences and Series158 Questions
Exam 12: Vectors and the Geometry of Space60 Questions
Exam 13: Vector Functions93 Questions
Exam 14: Partial Derivatives132 Questions
Exam 15: Multiple Integrals124 Questions
Exam 16: Vector Calculus137 Questions
Exam 17: Second-Order Differential Equations63 Questions
Exam 18: Final Exam44 Questions
Select questions type

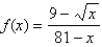
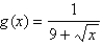
Find a function g that agrees with f for  and is continuous on
  .
. 
Free
(Essay)
4.7/5  (34)
(34)
Correct Answer: Verified
The symbol  can be used to denote the greatest integer function, which is defined by
  the greatest integer n such that
  Use the graph of the function to find the indicated limit, if it exists.
(Multiple Choice)
4.9/5 (33)
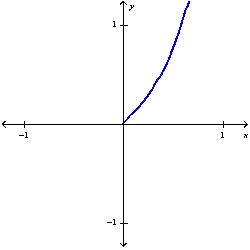
The following figure shows a portion of the graph of a function f defined on the interval  . Sketch the complete graph of f if it is known f is odd.
(Essay)
4.9/5 (33)
Find the numbers, if any, where the function 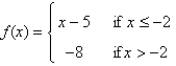 is discontinuous.
(Multiple Choice)
4.8/5 (40)
Find the numbers, if any, where the function 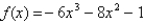 is discontinuous.
(Short Answer)
4.9/5 (35)
It makes sense that the larger the area of a region, the larger the number of species that inhabit the region. Many ecologists have modeled the species-area relation with a power function and, in particular, the number of species S of bats living in caves in central Mexico has been related to the surface area A measured in  of the caves by the equation
  (a) The cave called mission impossible near puebla, mexico, has suface area of
  .
How many species of bats would expect to find in that cave?
(b) If you discover that
.
How many species of bats would expect to find in that cave?
(b) If you discover that  species of bats live in cave estimate the area of the cave.
(Essay)
4.7/5 (34)
Refer to the graph of the function f in the following figure. 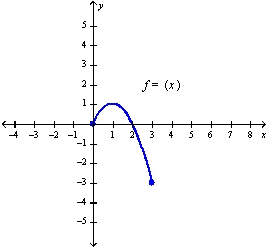 a.Find
  .
b.Find the value of x for which (i)
.
b.Find the value of x for which (i)  and (ii)
  .
c.Find the domain and range of f.
.
c.Find the domain and range of f.
(Essay)
4.9/5 (33)
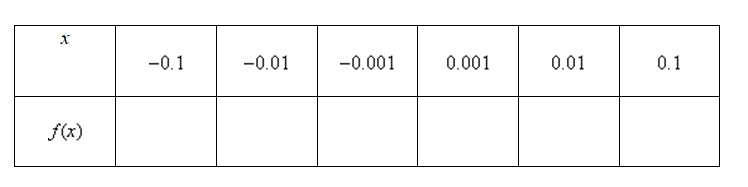
Complete the table by computing  at the given values of x, accurate to five decimal places. Use the results to guess at the indicated limit, if it exists, to three decimal places.
(Essay)
4.8/5 (32)
Estimate the value of the limit by graphing the function  . State your answer correct to two decimal places.
(Multiple Choice)
4.9/5 (36)
Filters
- Essay(0)
- Multiple Choice(0)
- Short Answer(0)
- True False(0)
- Matching(0)