Exam 27: Exploring Relationships Among Variables
Exam 2: Data28 Questions
Exam 3: Surveys and Sampling28 Questions
Exam 4: Displaying and Describing Categorical Data32 Questions
Exam 5: Displaying and Describing Quantitative Data32 Questions
Exam 6: Scatterplots, Association, and Correlation32 Questions
Exam 7: Introduction to Linear Regression32 Questions
Exam 8: Randomness and Probability32 Questions
Exam 9: Random Variables and Probability Distributions28 Questions
Exam 10: Sampling Distributions28 Questions
Exam 11: Confidence Intervals for Proportions32 Questions
Exam 12: Testing Hypotheses About Proportions36 Questions
Exam 13: Confidence Intervals and Hypothesis Tests for Means36 Questions
Exam 14: Comparing Two Means32 Questions
Exam 15: Design of Experiments and Analysis of Variance Anova24 Questions
Exam 16: Inference for Counts: Chi-Square Tests26 Questions
Exam 17: Nonparametric Methods23 Questions
Exam 18: Inference for Regression32 Questions
Exam 19: Understanding Regression Residuals28 Questions
Exam 20: Multiple Regression22 Questions
Exam 21: Building Multiple Regression Models22 Questions
Exam 22: Time Series Analysis28 Questions
Exam 23: Decision Making and Risk32 Questions
Exam 24: Quality Control28 Questions
Exam 25: Exploring and Collecting Data28 Questions
Exam 26: Understanding Probability Distributions and Statistical Inference70 Questions
Exam 27: Exploring Relationships Among Variables40 Questions
Exam 28: Using Statistics for Decision Making26 Questions
Select questions type
If we were interested in predicting the tourism revenue for a particular country that had 30 million foreign visitors
(Multiple Choice)
4.9/5  (37)
(37)
A forester would like to estimate the diameter of maple trees based on age. She gathers data from trees that have been cut and plots their diameters (in inches) against their ages (in years). She fits a linear model and both the scatterplot and residual plots are shown below. 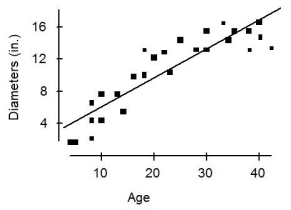
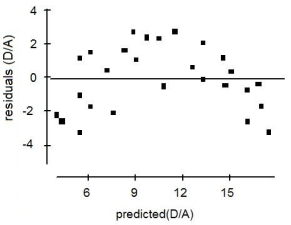 Which of the following is true?
(Multiple Choice)
4.9/5 (33)
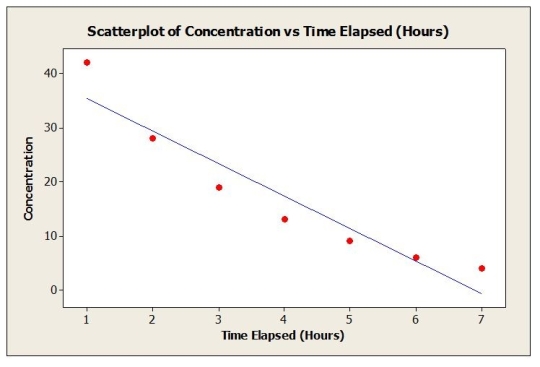
Use the following to answer the question(s) below.
A newly developed drug is tested to determine absorption levels in a patient's bloodstream. A patient is injected with the drug and the concentration (units/cc) in the patient's blood is measured every hour for seven hours. Below is the output from fitting a linear regression model. 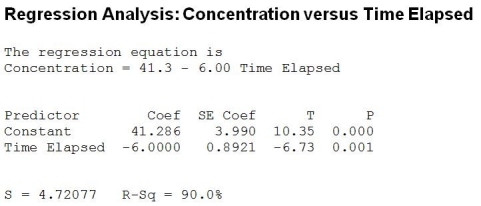
 -Re-expressing these data results in the following model
 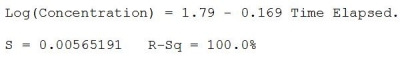 The residuals plotted against the fitted values for this model is shown below.
 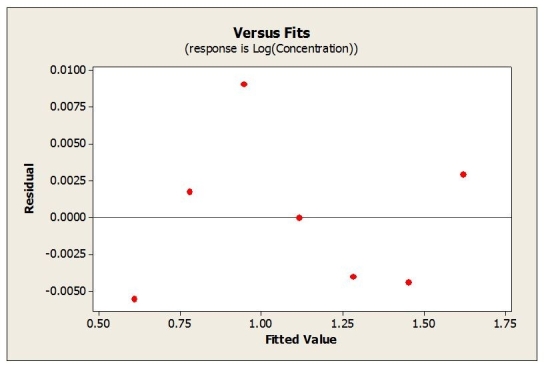 What is true about the predicted concentration level after 10 hours has elapsed?
(Multiple Choice)
4.8/5 (38)
Which of the following is not true about the best regression models?
(Multiple Choice)
4.8/5 (32)
Use the following to answer the question(s) below.
For many countries tourism is an important source of revenue. Data are collected on the number of foreign visitors to a country (in millions) and total tourism revenue (in billions of dollars) for a sample of 10 countries. Below is the regression analysis output with tourism revenue as the dependent variable. 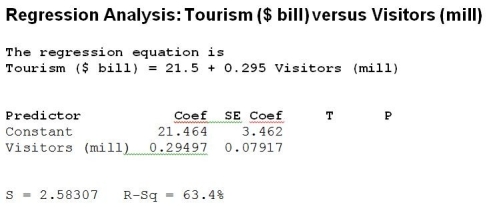 -The calculated t-statistic to test whether the regression slope is significantly different from zero is
(Multiple Choice)
4.7/5 (31)
Use the following to answer the question(s) below.
Stock prices and earnings per share (EPS) data were collected for a sample of 15 companies. Below are the regression results. The dependent variable is Stock Price. 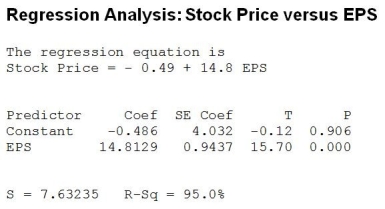 -What is the correlation between stock price and EPS?
(Multiple Choice)
4.7/5 (29)
The residual plot for a linear regression model is shown below. 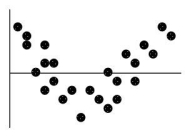 Which of the following is true?
(Multiple Choice)
4.8/5 (32)
A least squares estimated regression line has been fitted to a set of data and the resulting residual plot is shown. Which is true? 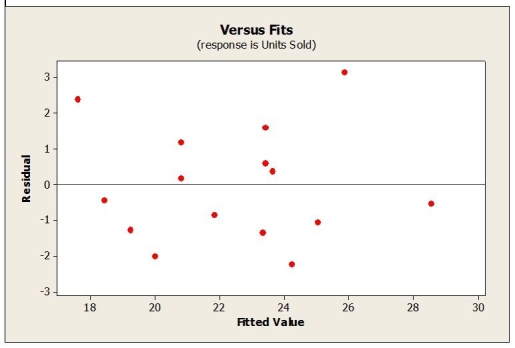
(Multiple Choice)
4.8/5 (37)
The model  = 3.30 + 0.235 × speed can be used to predict the stopping distance (in metres) for a car traveling at a specific speed (in kph). According to this model, about how much distance will a car going 65 kph need to stop?
(Multiple Choice)
4.9/5 (37)
Use the following to answer the question(s) below.
A newly developed drug is tested to determine absorption levels in a patient's bloodstream. A patient is injected with the drug and the concentration (units/cc) in the patient's blood is measured every hour for seven hours. Below is the output from fitting a linear regression model.
-Which of the following is true?
(Multiple Choice)
4.9/5 (27)
Use the following to answer the question(s) below.
Stock prices and earnings per share (EPS) data were collected for a sample of 15 companies. Below are the regression results. The dependent variable is Stock Price.
-Which of the following statement is true about the correlation between stock price and EPS?
(Multiple Choice)
4.8/5 (35)
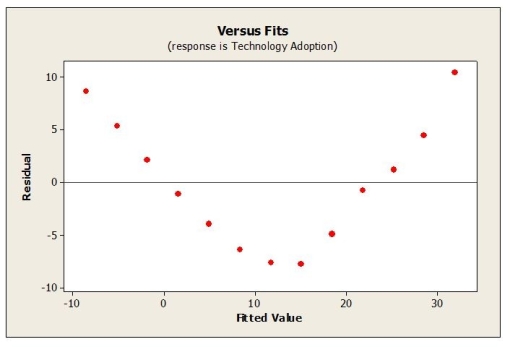
Use the following to answer the question(s) below.
A linear regression model was fit to data representing technology adoption over time. The regression output and residual plot appears below. 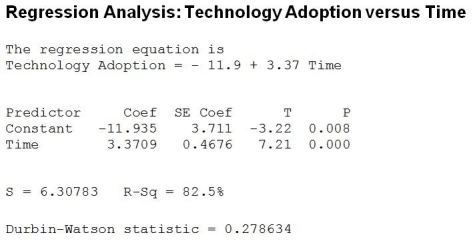
 -It is known that at 1% significance level the critical values for Durbin-Watson statistic are 0.738 and 1.038. The Durbin-Watson statistic indicates
(Multiple Choice)
5.0/5 (38)
Use the following to answer the question(s) below.
Data were collected for a sample of 12 pharmacists to determine if years of experience and salary are related. Below are the regression analysis results. The dependent variable is Salary in thousands of dollars. 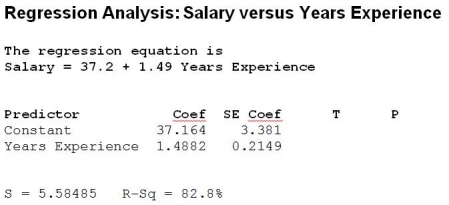 -The calculated t-statistic to test whether the regression slope is significant is
(Multiple Choice)
4.8/5 (34)
Use the following to answer the question(s) below.
Weekly commodity prices for heating oil (in cents) were obtained and regressed against time. Below is the regression output and residual plots from fitting a linear model. 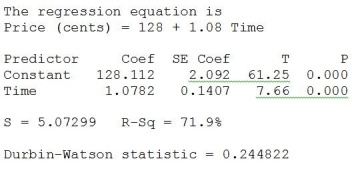
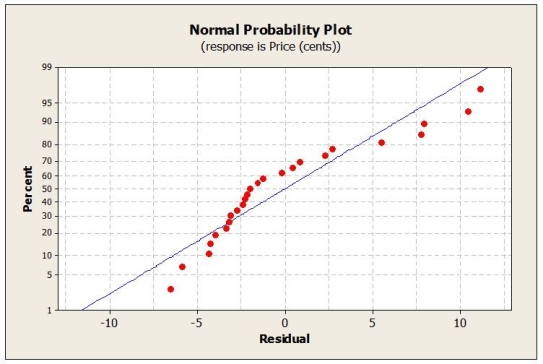 -The Durbin-Watson statistic indicates
(Multiple Choice)
4.8/5 (31)
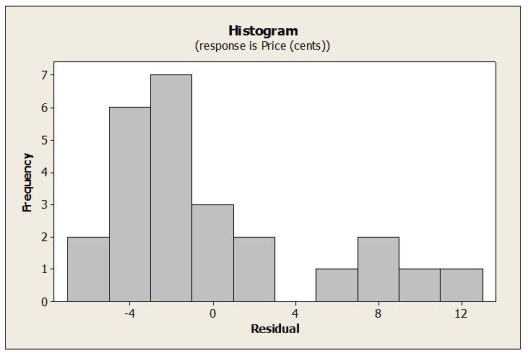
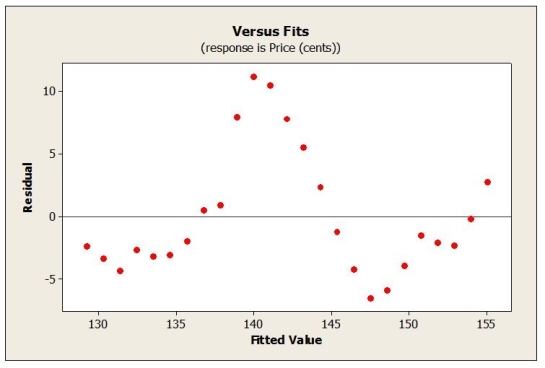
Below are residual plots for this regression model. 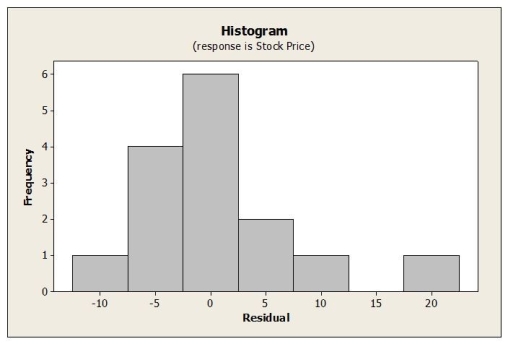
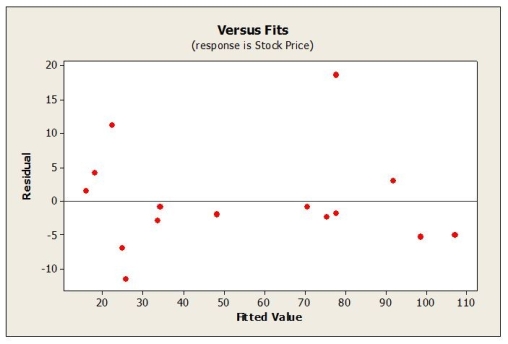
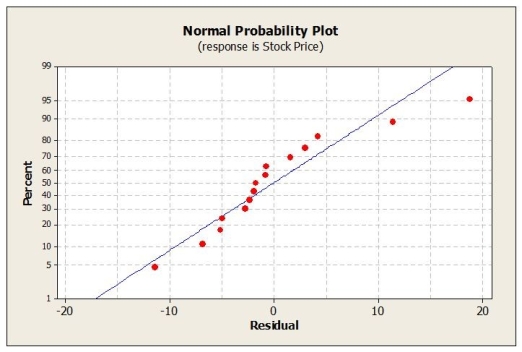 Based on these plots, which assumption appears to be violated?
(Multiple Choice)
4.9/5 (36)
Use the following to answer the question(s) below.
For many countries tourism is an important source of revenue. Data are collected on the number of foreign visitors to a country (in millions) and total tourism revenue (in billions of dollars) for a sample of 10 countries. Below is the regression analysis output with tourism revenue as the dependent variable.
-The standard error of the slope for this estimated regression equation is
(Multiple Choice)
4.9/5 (31)
Use the following to answer the question(s) below.
Weekly commodity prices for heating oil (in cents) were obtained and regressed against time. Below is the regression output and residual plots from fitting a linear model.
-Which assumption appears to be violated?
(Multiple Choice)
4.8/5 (29)
Which of the following measures is used to check for collinearity when building a multiple regression model?
(Multiple Choice)
4.7/5 (29)
Use the following to answer the questions below.
The following is output from regression analysis performed to develop a model for predicting a firm's Price-Earnings Ratio (PE) based on Growth Rate, Profit Margin, and whether or not the firm is Green (1 = Yes, 0 = No). 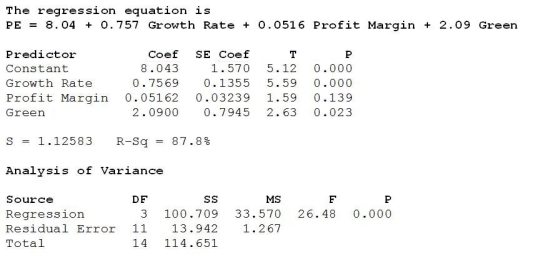 -At α = 0.05 we can conclude that
(Multiple Choice)
4.8/5 (29)
Which of the following is/are true about the best regression models?
(Multiple Choice)
4.9/5 (31)
Filters
- Essay(0)
- Multiple Choice(0)
- Short Answer(0)
- True False(0)
- Matching(0)