Exam 25: Exploring and Collecting Data
Exam 2: Data28 Questions
Exam 3: Surveys and Sampling28 Questions
Exam 4: Displaying and Describing Categorical Data32 Questions
Exam 5: Displaying and Describing Quantitative Data32 Questions
Exam 6: Scatterplots, Association, and Correlation32 Questions
Exam 7: Introduction to Linear Regression32 Questions
Exam 8: Randomness and Probability32 Questions
Exam 9: Random Variables and Probability Distributions28 Questions
Exam 10: Sampling Distributions28 Questions
Exam 11: Confidence Intervals for Proportions32 Questions
Exam 12: Testing Hypotheses About Proportions36 Questions
Exam 13: Confidence Intervals and Hypothesis Tests for Means36 Questions
Exam 14: Comparing Two Means32 Questions
Exam 15: Design of Experiments and Analysis of Variance Anova24 Questions
Exam 16: Inference for Counts: Chi-Square Tests26 Questions
Exam 17: Nonparametric Methods23 Questions
Exam 18: Inference for Regression32 Questions
Exam 19: Understanding Regression Residuals28 Questions
Exam 20: Multiple Regression22 Questions
Exam 21: Building Multiple Regression Models22 Questions
Exam 22: Time Series Analysis28 Questions
Exam 23: Decision Making and Risk32 Questions
Exam 24: Quality Control28 Questions
Exam 25: Exploring and Collecting Data28 Questions
Exam 26: Understanding Probability Distributions and Statistical Inference70 Questions
Exam 27: Exploring Relationships Among Variables40 Questions
Exam 28: Using Statistics for Decision Making26 Questions
Select questions type
Use the following to answer the question(s) below.
Suppose that in 2010 data were collected on the percent of people in Canada who had no employer pension plan. Summary statistics and a histogram for these data are shown below.

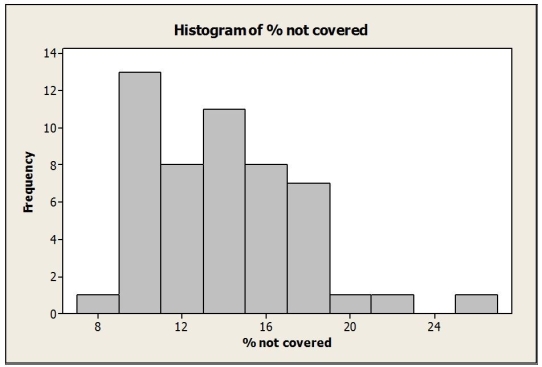 -What is the most appropriate measure to describe the centre of these data?
(Multiple Choice)
4.8/5  (40)
(40)
Use the following to answer the question(s) below.
Suppose that in 2010 data were collected on the percent of people in Canada who had no employer pension plan. Summary statistics and a histogram for these data are shown below.
-The IQR for these data is
(Multiple Choice)
4.8/5 (28)
A researcher is conducting a study on Internet use. He decides to first categorize the population by education level (high school, college graduate, advanced degree, etc.) and then survey a select number from each category. This sampling strategy is called
(Multiple Choice)
4.8/5 (27)
A researcher is conducting a study on eating disorders. Using a list of recent participants in the online Weight Watchers program, she randomly selects a name from the alphabetized list. She then chooses every tenth person from that point on to include in her study. This sampling strategy is called
(Multiple Choice)
4.9/5 (41)
An office supply chain has stores in two locations, Toronto and Vancouver. One of these stores is to be closed within the coming year, and to help make the decision, management reviews sales data. Below are boxplots for monthly unit sales for both locations. 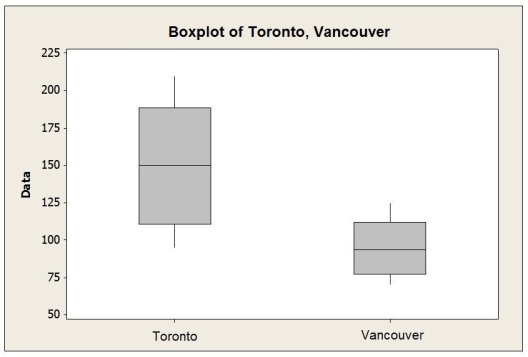 Which of the following statements is not correct?
(Multiple Choice)
4.8/5 (42)
In listing a property, real estate agencies provides information on a number of variables. Which of the following variables related to property listings is categorical?
(Multiple Choice)
4.9/5 (42)
Use the following to answer the question(s) below.
A recent survey of online shoppers asked them to indicate the primary reason they shop via the Internet. The table summarizes responses by reason and gender.
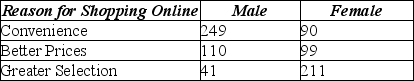 -What percent of respondents who cited Greater Selection as the primary reason they shop online were females?
(Multiple Choice)
4.8/5 (37)
Which is true of the data shown in the histogram? 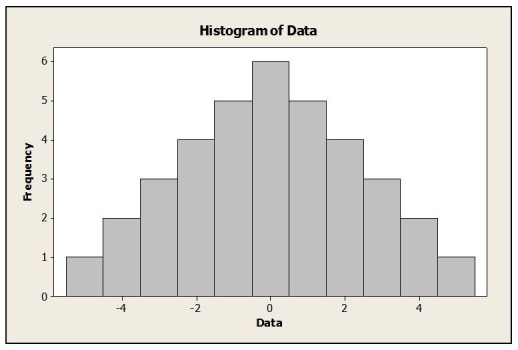 I. The distribution is approximately symmetric.
II. The mean and median are approximately equal.
III. The median and IQR to summarize these data summarize the data better than the mean and standard deviation.
I. The distribution is approximately symmetric.
II. The mean and median are approximately equal.
III. The median and IQR to summarize these data summarize the data better than the mean and standard deviation.
(Multiple Choice)
4.8/5 (31)
Filters
- Essay(0)
- Multiple Choice(0)
- Short Answer(0)
- True False(0)
- Matching(0)