Exam 6: Scatterplots, Association, and Correlation
Exam 2: Data28 Questions
Exam 3: Surveys and Sampling28 Questions
Exam 4: Displaying and Describing Categorical Data32 Questions
Exam 5: Displaying and Describing Quantitative Data32 Questions
Exam 6: Scatterplots, Association, and Correlation32 Questions
Exam 7: Introduction to Linear Regression32 Questions
Exam 8: Randomness and Probability32 Questions
Exam 9: Random Variables and Probability Distributions28 Questions
Exam 10: Sampling Distributions28 Questions
Exam 11: Confidence Intervals for Proportions32 Questions
Exam 12: Testing Hypotheses About Proportions36 Questions
Exam 13: Confidence Intervals and Hypothesis Tests for Means36 Questions
Exam 14: Comparing Two Means32 Questions
Exam 15: Design of Experiments and Analysis of Variance Anova24 Questions
Exam 16: Inference for Counts: Chi-Square Tests26 Questions
Exam 17: Nonparametric Methods23 Questions
Exam 18: Inference for Regression32 Questions
Exam 19: Understanding Regression Residuals28 Questions
Exam 20: Multiple Regression22 Questions
Exam 21: Building Multiple Regression Models22 Questions
Exam 22: Time Series Analysis28 Questions
Exam 23: Decision Making and Risk32 Questions
Exam 24: Quality Control28 Questions
Exam 25: Exploring and Collecting Data28 Questions
Exam 26: Understanding Probability Distributions and Statistical Inference70 Questions
Exam 27: Exploring Relationships Among Variables40 Questions
Exam 28: Using Statistics for Decision Making26 Questions
Select questions type
Consider the following to answer the question(s) below:
A consumer research group investigating the relationship between the price of meat (per pound) and the fat content (grams) gathered data that produced the following scatterplot. 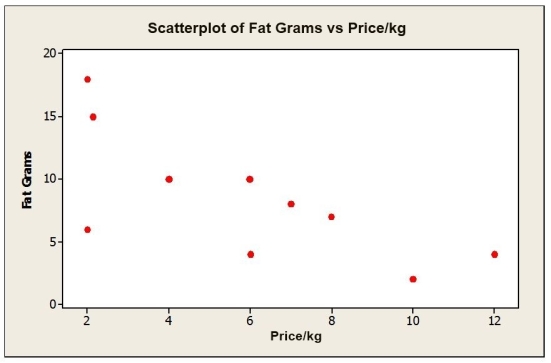 -If the point in the lower left hand corner ($2.00 per kilogram, 6 grams of fat) were removed, the correlation would most likely
(Multiple Choice)
4.7/5  (30)
(30)
If the correlation between two variables is determined to be 0.70, which of the following is known to be true?
(Multiple Choice)
4.9/5 (36)
For each of the following scenarios, indicate which is the predictor variable and which is the response variable.
a. A study examined consumption levels of oil and carbon dioxide emissions for a sample of counties.
b. Data were collected on job performance rating and hours of training for a sample of employees at a telecommunications repair facility.
c. Salary data as well as years of managerial experience were collected for a sample of executives in the high tech industry.
(Essay)
4.9/5 (32)
Consider the following to answer the question(s) below:
The following scatterplot shows monthly sales figures (in units) and the number of months of experience on the job for a sample of 18 salespeople. 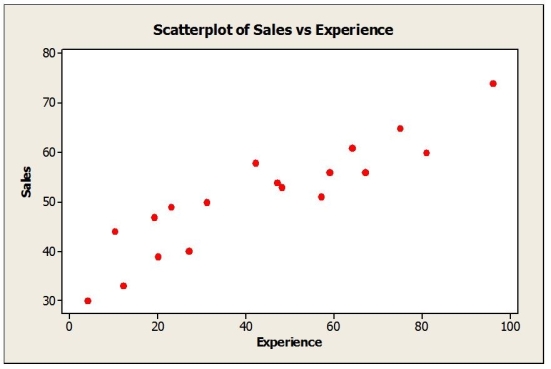 -The correlation between monthly sales and number of months of experience is most likely
(Multiple Choice)
4.7/5 (28)
In analyzing the relationship between two variables, a scatter plot can be used to detect which of the following?
(Multiple Choice)
4.9/5 (31)
The correlation associated with the following scatterplot is 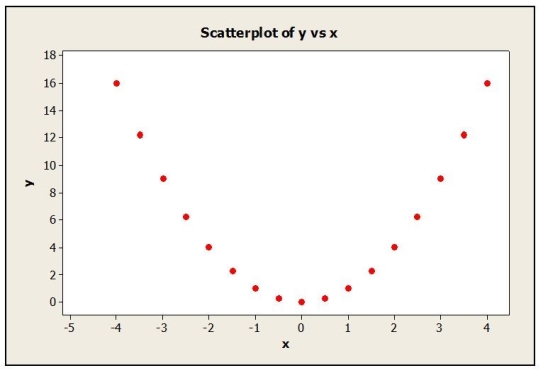
(Multiple Choice)
4.7/5 (42)
In discussing how its customers use online services, a bank manager noted "there seems to be a strong correlation between the use of the online bill paying feature and gender." Comment on this statement.
(Essay)
4.9/5 (36)
If a pair of variables have a curvilinear relationship, which of the following is true?
(Multiple Choice)
4.9/5 (32)
A study was done in which the daily temperature and the number of traffic accidents within the city were recorded. The standard deviations for the samples are 13.13 for temperature and 2.55 for accidents. These sample data are shown as follows: 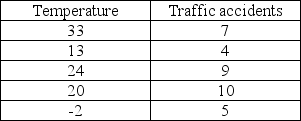 Given these data, the sample correlation is approximately
(Multiple Choice)
4.9/5 (35)
For each of the following scenarios, indicate which is the predictor variable and which is the response variable.
a. A supermarket chain gathers data on the amount they spend on promotional material (specials, coupons, etc.) and sales revenue generated each quarter.
b. Government sponsored research investigated the relationship between the number of hours individuals spend on the Internet and age.
c. A real estate association conducted a study on home prices and economic strength for different regions of Canada.
(Essay)
4.9/5 (29)
Based on the scatterplots shown below, describe the association between x and y.
a. 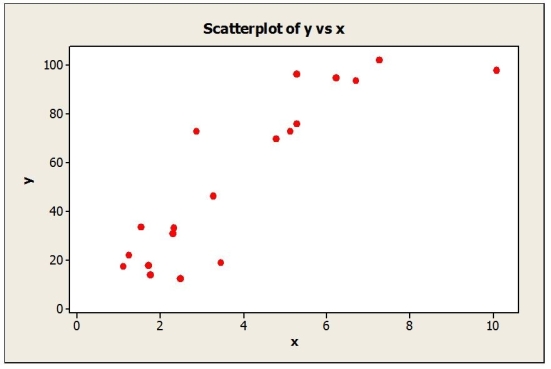 b.
b. 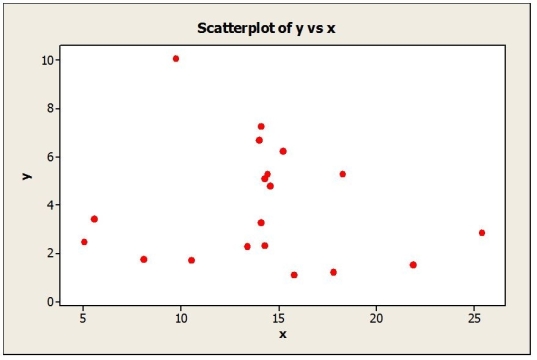
(Essay)
4.7/5 (46)
Government sponsored research investigated the relationship between the number of hours individuals spend on the Internet and age. Which of the following statements is true?
(Multiple Choice)
4.8/5 (38)
Filters
- Essay(0)
- Multiple Choice(0)
- Short Answer(0)
- True False(0)
- Matching(0)