Exam 17: The Short-Run Tradeoff Between Inflation and Unemployment
Exam 1: Ten Principles of Economics439 Questions
Exam 2: Thinking Like an Economist615 Questions
Exam 3: Interdependence and the Gains From Trade527 Questions
Exam 4: The Market Forces of Supply and Demand697 Questions
Exam 5: Measuring a Nations Income518 Questions
Exam 6: Measuring the Cost of Living543 Questions
Exam 7: Production and Growth507 Questions
Exam 8: Saving, Investment, and the Financial System565 Questions
Exam 9: The Basic Tools of Finance510 Questions
Exam 10: Unemployment and Its Natural Rate698 Questions
Exam 11: The Monetary System517 Questions
Exam 12: Money Growth and Inflation484 Questions
Exam 13: Open-Economy Macroeconomics: Basic Concepts520 Questions
Exam 14: A Macroeconomic Theory of the Open Economy478 Questions
Exam 15: Aggregate Demand and Aggregate Supply563 Questions
Exam 16: The Influence of Monetary and Fiscal Policy on Aggregate Demand510 Questions
Exam 17: The Short-Run Tradeoff Between Inflation and Unemployment516 Questions
Exam 18: Six Debates Over Macroeconomic Policy372 Questions
Select questions type
Suppose that the Prime Minister and Parliament of Veridian are disappointed with the high inflation rates under the current system where the Veridian Ministry of Finance is in charge of the money supply. They make reforms to lower inflation from its current rate of 8%. Suppose further that the public is confident that with the reforms in place that inflation will fall to 2%. Also suppose that those in control of the money supply actually conduct monetary policy so that the actual inflation rate is 4%. Using long-run and short-run Phillips curves and assuming the natural rate of unemployment is 6%, show the initial long run equilibrium of Veridian and label it "A". Assuming that the government had actually set inflation at 2% and that the public believed this, label the longrun equilibrium "B". Now, suppose that inflation expectations fell to 2% and that the government unexpectedly created inflation of 4%. Show the shortrun equilibrium and label it "C". If the money supply continues to grow at a rate consistent with 4% inflation, show where the economy ends up and label that point "D".
(Essay)
4.8/5  (33)
(33)
An adverse supply shock shifts the short-run Phillips curve right. If people raise their inflation expectations, the short-run Phillips curve shifts farther right.
(True/False)
4.8/5 (35)
After an oil price shock, which of the following would move unemployment back towards its natural rate?
(Multiple Choice)
4.8/5 (31)
If the central bank keeps the money supply growth rate constant, but people raise their inflation expectations by 1 percentage point, then the short-run Phillips curve shifts
(Multiple Choice)
4.8/5 (41)
If inflation expectations rise, the short-run Phillips curve shifts
(Multiple Choice)
4.8/5 (35)
Figure 35-2
Use the pair of diagrams below to answer the following questions.
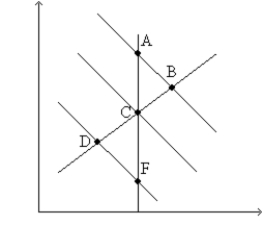 -Refer to Figure 35-2. If the economy starts at C and 1, then in the short run, a decrease in taxes moves the economy to
(Multiple Choice)
4.8/5 (39)
In 2009 Congress and President Obama approved tax cuts and increased government spending. According to the short-run Phillips curve these policies should have
(Multiple Choice)
4.7/5 (36)
The equation, Unemployment rate = Natural rate of unemployment - a × Αctual inflation - Expected inflation),
(Multiple Choice)
4.9/5 (45)
If expected inflation rises but actual inflation remains the same, what happens to the unemployment rate? Defend your answer.
(Essay)
4.8/5 (41)
The logic behind the tradeoff between inflation and unemployment is that high aggregate demand puts upward pressure on wages and prices while raising output.
(True/False)
4.9/5 (43)
If consumer confidence rises, then aggregate demand shifts
(Multiple Choice)
4.8/5 (30)
Figure 35-9. The left-hand graph shows a short-run aggregate-supply SRAS) curve and two aggregate-demand AD) curves. On the right-hand diagram, "Inf Rate" means "Inflation Rate." 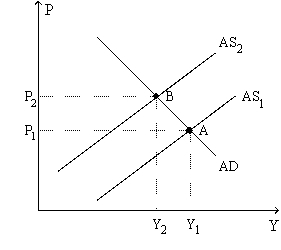
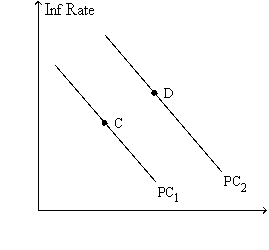 -Refer to Figure 35-9. What is measured along the horizontal axis of the right-hand graph?
(Multiple Choice)
4.7/5 (33)
A central bank raises the money supply growth rate and keeps it higher. As the economy moves from the short-run equilibrium created by the increase in the money supply growth back to long-run equilibrium what happens to the unemployment rate?
(Short Answer)
4.8/5 (33)
A favorable supply shock will shift short-run aggregate supply
(Multiple Choice)
5.0/5 (40)
U.S. net exports fall due to recessions in foreign countries.
A. According to the aggregate demand and supply model, what happens to the price level and output in the short run?
B. According to the short-run Phillips curve what happens to inflation and unemployment in the short run?
C. If the Fed wanted to reverse the effects of this shock on output, what should it do?
(Essay)
4.8/5 (35)
In which case, if any, will inflation remain higher after a temporary adverse supply shock?
(Multiple Choice)
4.9/5 (31)
A central bank can reduce inflation by reducing money supply growth, but it necessarily does so at the cost of permanently raising the unemployment rate.
(True/False)
4.8/5 (32)
France has a higher natural rate of unemployment than the United States. This suggests that
(Multiple Choice)
4.7/5 (35)
Filters
- Essay(0)
- Multiple Choice(0)
- Short Answer(0)
- True False(0)
- Matching(0)