Exam 17: The Short-Run Tradeoff Between Inflation and Unemployment
Exam 1: Ten Principles of Economics439 Questions
Exam 2: Thinking Like an Economist615 Questions
Exam 3: Interdependence and the Gains From Trade527 Questions
Exam 4: The Market Forces of Supply and Demand697 Questions
Exam 5: Measuring a Nations Income518 Questions
Exam 6: Measuring the Cost of Living543 Questions
Exam 7: Production and Growth507 Questions
Exam 8: Saving, Investment, and the Financial System565 Questions
Exam 9: The Basic Tools of Finance510 Questions
Exam 10: Unemployment and Its Natural Rate698 Questions
Exam 11: The Monetary System517 Questions
Exam 12: Money Growth and Inflation484 Questions
Exam 13: Open-Economy Macroeconomics: Basic Concepts520 Questions
Exam 14: A Macroeconomic Theory of the Open Economy478 Questions
Exam 15: Aggregate Demand and Aggregate Supply563 Questions
Exam 16: The Influence of Monetary and Fiscal Policy on Aggregate Demand510 Questions
Exam 17: The Short-Run Tradeoff Between Inflation and Unemployment516 Questions
Exam 18: Six Debates Over Macroeconomic Policy372 Questions
Select questions type
Which of the following is correct if there is a favorable supply shock?
(Multiple Choice)
4.9/5  (33)
(33)
Prime Minister Emma Bigshot urges passage of a bill to reduce unemployment benefits from very generous levels in her country. She also urges her country's central bank to raise the rate at which the money supply is increasing. In the long run which, if either, of these policies will reduce the unemployment rate?
(Multiple Choice)
4.9/5 (44)
When monetary and fiscal policymakers expand aggregate demand, which of the following costs is incurred in the short run?
(Multiple Choice)
4.8/5 (39)
Figure 35-9. The left-hand graph shows a short-run aggregate-supply SRAS) curve and two aggregate-demand AD) curves. On the right-hand diagram, "Inf Rate" means "Inflation Rate." 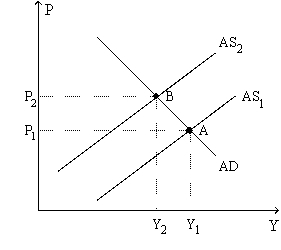
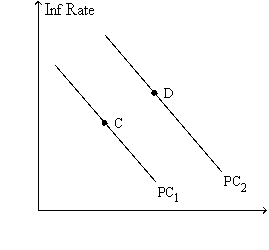 -Refer to Figure 35-9. Faced with the shift of the Phillips curve from PC1 to PC2, policymakers will
(Multiple Choice)
4.7/5 (31)
If the Fed were to increase the money supply, inflation would increase and unemployment would decrease in the short run.
(True/False)
4.9/5 (27)
According to the Friedman-Phelps analysis, in the long run actual inflation equals expected inflation and unemployment is at its natural rate.
(True/False)
4.9/5 (38)
During the financial crisis Congress and President Obama authorized tax cuts and increases in government spending.
According to the Phillips curve, in the short run these policies should have
(Multiple Choice)
4.9/5 (29)
The "natural" rate of unemployment is the unemployment rate toward which the economy gravitates in the
(Multiple Choice)
4.8/5 (36)
Figure 35-4. The left-hand graph shows a short-run aggregate-supply SRAS) curve and two aggregate-demand AD curves. On the left-hand diagram, the price level is measured on the vertical axis; on the right-hand diagram, the inflation rate is measured on the vertical axis. 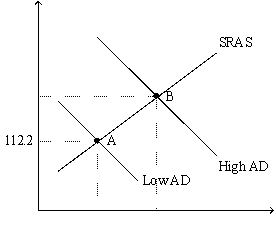
 -Refer to Figure 35-4. Assume the figure charts possible outcomes for the year 2018. In 2018, the economy is at point B on the left-hand graph, which corresponds to point B on the right-hand graph. Also, point A on the left-hand graph corresponds to A on the right-hand graph. The price level in the year 2018 is
(Multiple Choice)
4.7/5 (38)
Which of the following would we not expect if government policy moved the economy up along a given short-run Phillips curve?
(Multiple Choice)
4.8/5 (43)
In the long run, policy that changes aggregate demand changes
(Multiple Choice)
4.9/5 (34)
Figure 35-6
Use the graph below to answer the following questions. 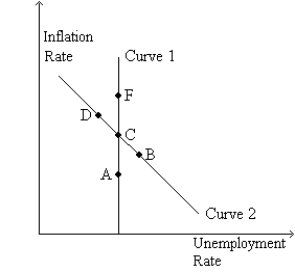 -Refer to Figure 35-6. If the economy starts at C and the money supply growth rate decreases, in the short run the economy moves to
(Multiple Choice)
4.8/5 (40)
The equation, Unemployment rate = Natural rate of unemployment - a × Αctual inflation - Expected inflation),
(Multiple Choice)
4.8/5 (34)
A central bank raises the money supply growth rate and keeps it at that higher rate. Explain the process by which the economy moves to long-run equilibrium.
(Essay)
4.8/5 (38)
Does a more steeply sloped Phillips curve make the sacrifice ratio smaller or larger than otherwise?
(Essay)
4.9/5 (44)
In the long run, the natural rate of unemployment depends primarily on the growth rate of the money supply.
(True/False)
4.8/5 (38)
If the Fed wants to reverse the effects of a favorable supply shock on unemployment, it should
(Multiple Choice)
4.9/5 (28)
Which of the following would shift the long-run Phillips curve to the right?
(Multiple Choice)
4.9/5 (28)
If monetary policy moves unemployment below its natural rate, both expected and actual inflation will rise.
(True/False)
4.8/5 (35)
Filters
- Essay(0)
- Multiple Choice(0)
- Short Answer(0)
- True False(0)
- Matching(0)