Exam 17: The Short-Run Tradeoff Between Inflation and Unemployment
Exam 1: Ten Principles of Economics439 Questions
Exam 2: Thinking Like an Economist615 Questions
Exam 3: Interdependence and the Gains From Trade527 Questions
Exam 4: The Market Forces of Supply and Demand697 Questions
Exam 5: Measuring a Nations Income518 Questions
Exam 6: Measuring the Cost of Living543 Questions
Exam 7: Production and Growth507 Questions
Exam 8: Saving, Investment, and the Financial System565 Questions
Exam 9: The Basic Tools of Finance510 Questions
Exam 10: Unemployment and Its Natural Rate698 Questions
Exam 11: The Monetary System517 Questions
Exam 12: Money Growth and Inflation484 Questions
Exam 13: Open-Economy Macroeconomics: Basic Concepts520 Questions
Exam 14: A Macroeconomic Theory of the Open Economy478 Questions
Exam 15: Aggregate Demand and Aggregate Supply563 Questions
Exam 16: The Influence of Monetary and Fiscal Policy on Aggregate Demand510 Questions
Exam 17: The Short-Run Tradeoff Between Inflation and Unemployment516 Questions
Exam 18: Six Debates Over Macroeconomic Policy372 Questions
Select questions type
Monetary Policy in Flosserland
In Flosserland, the Department of Finance is responsible for monetary policy. Flosserland has had an inflation rate of 25% for many years.
-Refer to Monetary Policy in Flosserland. Suppose the Flosserland Department of Finance has run a public relations campaign claiming it will reduce inflation to 12.5% and actually reduces inflation to that level. Suppose at first that the public thought inflation would only drop to 18%, but eventually become convinced that the inflation rate will stay at 12.5%.
(Multiple Choice)
4.9/5  (35)
(35)
If the central bank increases the money supply, in the short run, output
(Multiple Choice)
4.8/5 (40)
The sacrifice ratio is the percentage point increase in the unemployment rate created in the process of reducing inflation by one percentage point.
(True/False)
4.8/5 (34)
Figure 35-1. The left-hand graph shows a short-run aggregate-supply SRAS) curve and two aggregate-demand AD curves. On the right-hand diagram, U represents the unemployment rate.
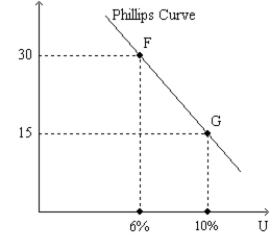
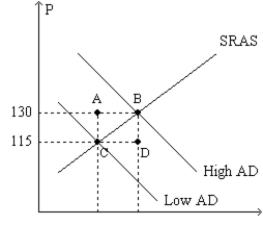 -Refer to Figure 35-1. Suppose points F and G on the right-hand graph represent two possible outcomes for an imaginary economy in the year 2012, and those two points correspond to points B and C, respectively, on the left- hand graph. Also suppose we know that the price index equaled 120 in 2011. Then the numbers 115 and 130 on the vertical axis of the left-hand graph would have to be replaced by
(Multiple Choice)
4.9/5 (39)
In 1979, when the Fed was deciding how aggressively to fight inflation, the typical estimate of the sacrifice ratio was
(Multiple Choice)
4.8/5 (41)
Closely watched indicators such as the inflation rate and unemployment are released each month by the
(Multiple Choice)
4.7/5 (30)
Figure 35-1. The left-hand graph shows a short-run aggregate-supply SRAS) curve and two aggregate-demand AD curves. On the right-hand diagram, U represents the unemployment rate.
-Refer to Figure 35-1. Assuming the price level in the previous year was 100, point F on the right-hand graph corresponds to
(Multiple Choice)
4.9/5 (43)
If the central bank increases the growth rate of the money supply and initially inflation expectations are unchanged, then in the short run
(Multiple Choice)
4.8/5 (36)
Which of the following is not associated with an adverse supply shock?
(Multiple Choice)
4.9/5 (31)
The Economy in 2008
In the first half of June 2008 the effects of a housing and financial crisis and an increase in world prices of oil and foodstuffs were affecting the economy.
-Refer to The Economy in 2008. The short-run effects of the housing and financial crisis are shown by
(Multiple Choice)
4.8/5 (42)
A low sacrifice ratio would make a central bank less willing to reduce the inflation rate.
(True/False)
4.8/5 (43)
The economy will move to a point on the short-run Phillips curve where unemployment is higher if
(Multiple Choice)
4.9/5 (46)
Suppose that the Fed unexpectedly pursues contractionary monetary policy. What will happen to unemployment in the short run? What will happen to unemployment in the long run? Justify your answer using the Phillips curves.
(Essay)
4.9/5 (41)
A policy intended to reduce unemployment by taking advantage of a tradeoff between inflation and unemployment leads to
(Multiple Choice)
4.9/5 (44)
If the economy is at the point where the short-run Phillips curve intersects the long-run Phillips curve,
(Multiple Choice)
4.9/5 (33)
Figure 35-2
Use the pair of diagrams below to answer the following questions.
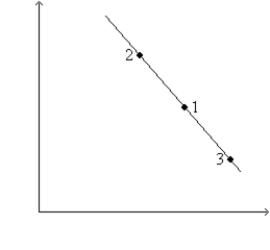
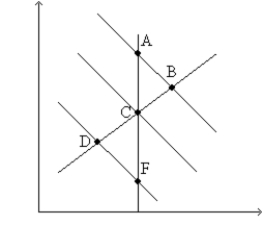 -Refer to Figure 35-2. If the economy starts at C and 1, then in the short run, a decrease in the money supply moves the economy to
(Multiple Choice)
4.8/5 (34)
Other things the same, if the central bank decreases the rate at which it increases the money supply, then
(Multiple Choice)
4.7/5 (41)
Suppose expected inflation and actual inflation are both relatively high, and unemployment is at its natural rate. If the Fed then pursues a contractionary monetary policy, which of the following results would be expected in the short run?
(Multiple Choice)
4.7/5 (39)
Filters
- Essay(0)
- Multiple Choice(0)
- Short Answer(0)
- True False(0)
- Matching(0)