Exam 17: The Short-Run Tradeoff Between Inflation and Unemployment
Exam 1: Ten Principles of Economics439 Questions
Exam 2: Thinking Like an Economist615 Questions
Exam 3: Interdependence and the Gains From Trade527 Questions
Exam 4: The Market Forces of Supply and Demand697 Questions
Exam 5: Measuring a Nations Income518 Questions
Exam 6: Measuring the Cost of Living543 Questions
Exam 7: Production and Growth507 Questions
Exam 8: Saving, Investment, and the Financial System565 Questions
Exam 9: The Basic Tools of Finance510 Questions
Exam 10: Unemployment and Its Natural Rate698 Questions
Exam 11: The Monetary System517 Questions
Exam 12: Money Growth and Inflation484 Questions
Exam 13: Open-Economy Macroeconomics: Basic Concepts520 Questions
Exam 14: A Macroeconomic Theory of the Open Economy478 Questions
Exam 15: Aggregate Demand and Aggregate Supply563 Questions
Exam 16: The Influence of Monetary and Fiscal Policy on Aggregate Demand510 Questions
Exam 17: The Short-Run Tradeoff Between Inflation and Unemployment516 Questions
Exam 18: Six Debates Over Macroeconomic Policy372 Questions
Select questions type
Samuelson and Solow believed that the Phillips curve offered policymakers a menu of possible economic outcomes.
(True/False)
4.9/5  (40)
(40)
If policymakers expand aggregate demand, then in the long run
(Multiple Choice)
4.8/5 (33)
Figure 35-2
Use the pair of diagrams below to answer the following questions.
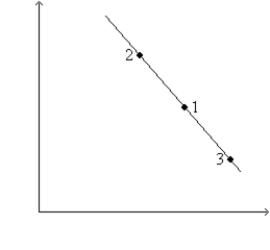
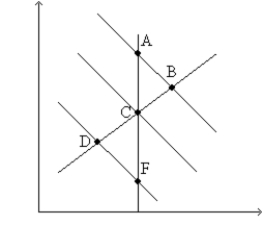 -Refer to Figure 35-2. If the economy starts at C and 1, then in the short run, a decrease in government expenditures moves the economy to
(Multiple Choice)
4.8/5 (35)
Figure 35-2
Use the pair of diagrams below to answer the following questions.
-Refer to Figure 35-2. If the economy starts at C and 1, then in the short run, an increase in government expenditures moves the economy to
(Multiple Choice)
4.9/5 (47)
Proponents of rational expectations argued that the sacrifice ratio
(Multiple Choice)
5.0/5 (41)
If a central bank reduced inflation by 4 percentage points and this made output fall by 5 percent for one year and 3 percent for another year and the unemployment rate rise 2.5 percent above its natural rate for one year and 1.5 percent above its natural rate for another year, the sacrifice ratio was
(Multiple Choice)
4.7/5 (42)
Other things constant, which of the following would reduce unemployment and raise inflation?
(Multiple Choice)
4.8/5 (38)
According to the Phillips curve, which fiscal policies can be used to reduce unemployment in the short run?
(Essay)
5.0/5 (46)
A movement to the left along a given short-run Phillips curve could be caused by
(Multiple Choice)
4.8/5 (35)
If prices and wages adjusted rapidly and producers could quickly distinguish the difference between a change in the price level and a change in the relative price of their products, then an increase in the money supply growth rate would have at most a very short-lived affect on unemployment.
(True/False)
5.0/5 (36)
If there is a large and sudden but temporary increase in the price of oil, which way does the short-run Phillips curve shift? If the central bank does not respond what happens to inflation and the unemployment rate in the long run?
(Essay)
4.7/5 (35)
An economy has a current inflation rate of 7%. If the central bank wants to reduce inflation to 4% and the sacrifice ratio is 2, then how much annual output must be sacrificed in the transition?
(Multiple Choice)
4.8/5 (37)
The Economy in 2008
In the first half of June 2008 the effects of a housing and financial crisis and an increase in world prices of oil and foodstuffs were affecting the economy.
-Refer to the Economy in 2008. The effects of increased prices of world commodities is shown by shifting
(Multiple Choice)
4.8/5 (47)
Although monetary policy cannot reduce the natural rate of unemployment, other types of government policies can.
(True/False)
4.9/5 (42)
When aggregate demand shifts left along the short-run aggregate supply curve,
(Multiple Choice)
4.8/5 (43)
Figure 35-9. The left-hand graph shows a short-run aggregate-supply SRAS) curve and two aggregate-demand AD) curves. On the right-hand diagram, "Inf Rate" means "Inflation Rate." 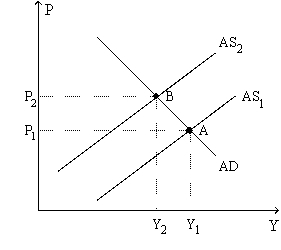
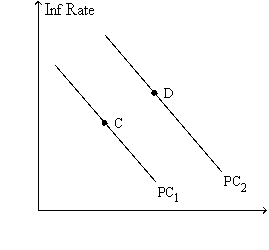 -Refer to Figure 35-9. A significant increase in the world price of oil could explain
(Multiple Choice)
4.7/5 (43)
If the Fed responded to an adverse supply shock by increasing the growth rate of the money supply and maintained the higher growth rate, what would eventually happen to the short-run Phillips curve? Why?
(Essay)
4.7/5 (42)
Filters
- Essay(0)
- Multiple Choice(0)
- Short Answer(0)
- True False(0)
- Matching(0)