Exam 17: The Short-Run Tradeoff Between Inflation and Unemployment
Exam 1: Ten Principles of Economics439 Questions
Exam 2: Thinking Like an Economist615 Questions
Exam 3: Interdependence and the Gains From Trade527 Questions
Exam 4: The Market Forces of Supply and Demand697 Questions
Exam 5: Measuring a Nations Income518 Questions
Exam 6: Measuring the Cost of Living543 Questions
Exam 7: Production and Growth507 Questions
Exam 8: Saving, Investment, and the Financial System565 Questions
Exam 9: The Basic Tools of Finance510 Questions
Exam 10: Unemployment and Its Natural Rate698 Questions
Exam 11: The Monetary System517 Questions
Exam 12: Money Growth and Inflation484 Questions
Exam 13: Open-Economy Macroeconomics: Basic Concepts520 Questions
Exam 14: A Macroeconomic Theory of the Open Economy478 Questions
Exam 15: Aggregate Demand and Aggregate Supply563 Questions
Exam 16: The Influence of Monetary and Fiscal Policy on Aggregate Demand510 Questions
Exam 17: The Short-Run Tradeoff Between Inflation and Unemployment516 Questions
Exam 18: Six Debates Over Macroeconomic Policy372 Questions
Select questions type
A central bank sets out to reduce unemployment by changing the money supply growth rate. The long-run Phillips curve shows that in comparison to their original rates, this policy will eventually lead to
(Multiple Choice)
4.8/5  (26)
(26)
Monetary Policy in Flosserland
In Flosserland, the Department of Finance is responsible for monetary policy. Flosserland has had an inflation rate of 25% for many years.
-Refer to Monetary Policy in Mokania. The Bank of Mokania reduced inflation to its announced goal of 5%. However the unemployment rate was on average higher for many years after. A newspaper editorial argues that the unemployment rate had moved to this higher natural rate because 1) by itself the decrease in inflation had permanently increased unemployment and 2) that at the same time the central bank was fighting inflation the government of Mokania had made a large increase in the minimum wage. Which of these arguments is consistent with the Phillip's curve model?
(Multiple Choice)
4.9/5 (51)
If there is a favorable supply shock which direction does the short-run Phillips curve shift? What initially happens to unemployment and inflation as a result of this shock?
(Essay)
4.8/5 (34)
If the sacrifice ratio is 2, reducing the inflation rate from 4 percent to 2 percent would
(Multiple Choice)
4.9/5 (44)
As aggregate demand shifts left along the short-run aggregate supply curve,
(Multiple Choice)
4.9/5 (35)
Which of the following increases inflation and reduces unemployment in the short run?
(Multiple Choice)
4.9/5 (44)
What did Friedman and Phelps predict would happen if policymakers tried to move the economy upward along the Phillips curve? Did the behavior of the economy in the late 1960s and the 1970s prove them wrong?
(Essay)
4.9/5 (46)
Figure 35-1. The left-hand graph shows a short-run aggregate-supply SRAS) curve and two aggregate-demand AD curves. On the right-hand diagram, U represents the unemployment rate.
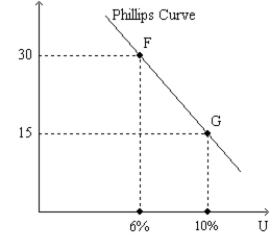
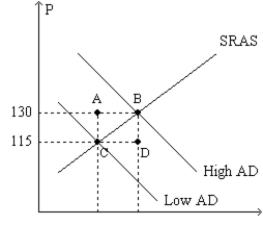 -Refer to Figure 35-1. Suppose points F and G on the right-hand graph represent two possible outcomes for an imaginary economy in the year 2012, and those two points correspond to points B and C, respectively, on the left- hand graph. Then it is apparent that the price index equaled
(Multiple Choice)
4.9/5 (38)
Short-run outcomes in the economy can be expressed in terms of output and the price level, or in terms of unemployment and inflation.
(True/False)
4.8/5 (28)
If the central bank decreases the money supply, then output
(Multiple Choice)
4.9/5 (38)
A policy change that changes the natural rate of unemployment changes
(Multiple Choice)
4.8/5 (37)
To say that the natural rate of unemployment changes over time is to say that
(Multiple Choice)
4.7/5 (38)
According to the Phillips curve, unemployment and inflation are negatively related in
(Multiple Choice)
4.7/5 (37)
Milton Friedman and Edmund Phelps argued in the late 1960s that in the long run the Phillips curve is
(Multiple Choice)
4.8/5 (33)
Are the effects of an increase in aggregate demand in the aggregate demand and aggregate supply model consistent with the Phillips curve? Explain.
(Essay)
5.0/5 (29)
Filters
- Essay(0)
- Multiple Choice(0)
- Short Answer(0)
- True False(0)
- Matching(0)