Exam 17: The Short-Run Tradeoff Between Inflation and Unemployment
Exam 1: Ten Principles of Economics439 Questions
Exam 2: Thinking Like an Economist615 Questions
Exam 3: Interdependence and the Gains From Trade527 Questions
Exam 4: The Market Forces of Supply and Demand697 Questions
Exam 5: Measuring a Nations Income518 Questions
Exam 6: Measuring the Cost of Living543 Questions
Exam 7: Production and Growth507 Questions
Exam 8: Saving, Investment, and the Financial System565 Questions
Exam 9: The Basic Tools of Finance510 Questions
Exam 10: Unemployment and Its Natural Rate698 Questions
Exam 11: The Monetary System517 Questions
Exam 12: Money Growth and Inflation484 Questions
Exam 13: Open-Economy Macroeconomics: Basic Concepts520 Questions
Exam 14: A Macroeconomic Theory of the Open Economy478 Questions
Exam 15: Aggregate Demand and Aggregate Supply563 Questions
Exam 16: The Influence of Monetary and Fiscal Policy on Aggregate Demand510 Questions
Exam 17: The Short-Run Tradeoff Between Inflation and Unemployment516 Questions
Exam 18: Six Debates Over Macroeconomic Policy372 Questions
Select questions type
Figure 35-9. The left-hand graph shows a short-run aggregate-supply SRAS) curve and two aggregate-demand AD) curves. On the right-hand diagram, "Inf Rate" means "Inflation Rate." 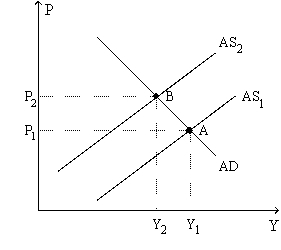
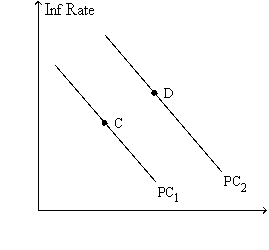 -Refer to Figure 35-9. Subsequent to the shift of the Phillips curve from PC1 to PC2, the curve will soon shift back to PC1 if people perceive the
(Multiple Choice)
4.9/5  (41)
(41)
As an economist working for a U.S. government agency you determine that a particular country has a sacrifice ratio of 3. Policy-makers in that country are thinking of lowering the inflation rate from 10% to 4%. Is this sacrifice ratio higher or lower than the typical estimate? From your numbers, what is the amount of output that will be lost for this country to reduce its inflation rate?
(Multiple Choice)
4.9/5 (41)
Monetary Policy in Flosserland
In Flosserland, the Department of Finance is responsible for monetary policy. Flosserland has had an inflation rate of 25% for many years.
-Refer to Monetary Policy in Flosserland. Suppose that the Flosserland Department of Finance has run a public relations campaign claiming it will reduce inflation to 12.5% and that it actually reduces inflation to that level. Suppose that the public was very skeptical and in fact thought the Flosserland Department of Finance was going to raise inflation to 30% so it could increase its expenditures. Then
(Multiple Choice)
4.7/5 (32)
Figure 35-5 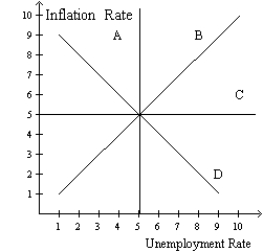 -Refer to figure 35-5. In this order, which curve is a long-run Phillips curve and which is a short-run Phillips curve?
(Multiple Choice)
4.9/5 (40)
If asset prices fall and inflation expectations remain unchanged, what happens to inflation and unemployment? Defend your answer.
(Essay)
4.9/5 (41)
Government expenditures increase. What happens to the price level and output? Explain how the change in the price level and output effect the inflation rate and the unemployment rate.
(Essay)
4.8/5 (34)
Other things the same, if there is an increase in the money supply growth rate that is larger than expected, then in the short run
(Multiple Choice)
4.8/5 (33)
Monetary Policy in Flosserland
In Flosserland, the Department of Finance is responsible for monetary policy. Flosserland has had an inflation rate of 25% for many years.
-Refer to Monetary Policy in Flosserland. Suppose that the Flosserland Department of Finance undertakes a public relations campaign to convince people that it will soon change monetary policy to reduce inflation to 12.5%. If Flosserlanders believe their government then which, if any, curves) shift left?
(Multiple Choice)
4.8/5 (41)
If people believe that the central bank is going to reduce inflation, then
(Multiple Choice)
4.9/5 (36)
Monetary Policy in Flosserland
In Flosserland, the Department of Finance is responsible for monetary policy. Flosserland has had an inflation rate of 25% for many years.
-Refer to Monetary Policy in Flosserland. Suppose that the Flosserland Department of Finance has run a public relations campaign claiming it will reduce inflation to 12.5% but it actually raises inflation to 30%. Suppose that the public had expected that the Department of Finance would reduce inflation but only to 22%. Then
(Multiple Choice)
4.9/5 (36)
Natural rate of unemployment - a × Αctual inflation - Expected inflation) =
(Multiple Choice)
4.9/5 (36)
Friedman argued that the Fed could use monetary policy to peg
(Multiple Choice)
4.8/5 (31)
Figure 35-3. The left-hand graph shows a short-run aggregate-supply SRAS) curve and two aggregate-demand AD) curves. On the left-hand diagram, Y represents output and on the right-hand diagram, U represents the unemployment rate. 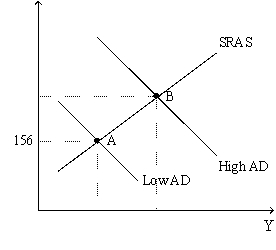
 -Refer to Figure 35-3. Assume the figure depicts possible outcomes for the year 2018. In 2018, the economy is at point A on the left-hand graph, which corresponds to point A on the right-hand graph. The price level in the year 2017 was
(Multiple Choice)
4.9/5 (37)
Friedman and Phelps argued that it was dangerous to think of the short-run Phillips curve as a menu of options for policymakers to choose from. Explain the logic of their argument.
(Essay)
4.7/5 (41)
If a central bank increases the money supply in response to an adverse supply shock, then which of the following quantities moves closer to its pre-shock value as a result?
(Multiple Choice)
4.8/5 (34)
Filters
- Essay(0)
- Multiple Choice(0)
- Short Answer(0)
- True False(0)
- Matching(0)