Exam 17: The Short-Run Tradeoff Between Inflation and Unemployment
Exam 1: Ten Principles of Economics439 Questions
Exam 2: Thinking Like an Economist615 Questions
Exam 3: Interdependence and the Gains From Trade527 Questions
Exam 4: The Market Forces of Supply and Demand697 Questions
Exam 5: Measuring a Nations Income518 Questions
Exam 6: Measuring the Cost of Living543 Questions
Exam 7: Production and Growth507 Questions
Exam 8: Saving, Investment, and the Financial System565 Questions
Exam 9: The Basic Tools of Finance510 Questions
Exam 10: Unemployment and Its Natural Rate698 Questions
Exam 11: The Monetary System517 Questions
Exam 12: Money Growth and Inflation484 Questions
Exam 13: Open-Economy Macroeconomics: Basic Concepts520 Questions
Exam 14: A Macroeconomic Theory of the Open Economy478 Questions
Exam 15: Aggregate Demand and Aggregate Supply563 Questions
Exam 16: The Influence of Monetary and Fiscal Policy on Aggregate Demand510 Questions
Exam 17: The Short-Run Tradeoff Between Inflation and Unemployment516 Questions
Exam 18: Six Debates Over Macroeconomic Policy372 Questions
Select questions type
If the short-run Phillips curve were stable, which of the following would be unusual?
(Multiple Choice)
4.9/5  (43)
(43)
According to the long-run Phillips curve, in the long run monetary policy influences
(Multiple Choice)
4.9/5 (34)
Economist A.W. Phillips found a negative correlation between
(Multiple Choice)
4.7/5 (39)
If the Fed announced a policy to reduce inflation and people found it credible, the short-run Phillips curve would shift
(Multiple Choice)
4.9/5 (42)
The restrictive monetary policy followed by the Fed in the early 1980s
(Multiple Choice)
4.8/5 (30)
Suppose that a small economy that produces mostly agricultural goods experiences a year with exceptionally good conditions for growing crops. The good weather would
(Multiple Choice)
5.0/5 (31)
The short-run Phillips curve is based on the classical dichotomy.
(True/False)
4.7/5 (44)
In the long run, a decrease in the money supply growth rate
(Multiple Choice)
4.9/5 (39)
If expected inflation falls but actual inflation remains the same, what happens to the unemployment rate? Defend your answer.
(Essay)
4.9/5 (39)
An adverse supply shock shifts the short-run Phillips curve right and the short-run aggregate-supply curve left.
(True/False)
4.9/5 (35)
An adverse supply shock shifts the short-run Phillips curve to the
(Multiple Choice)
4.9/5 (37)
The economist A.W. Phillips published a famous article in 1958 in which he showed a
(Multiple Choice)
5.0/5 (37)
Figure 35-2
Use the pair of diagrams below to answer the following questions.
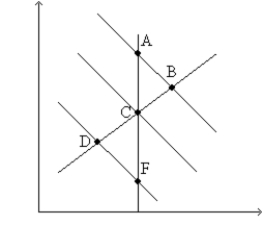 -Refer to Figure 35-2. If the economy starts at C and 1, then in the short run, an increase in the money supply growth rate moves the economy to
(Multiple Choice)
4.8/5 (40)
According to the Phillips curve, policymakers could reduce both inflation and unemployment by
(Multiple Choice)
4.8/5 (39)
In his famous article published in an economics journal in 1958, A.W. Phillips
(Multiple Choice)
4.9/5 (32)
In response to the financial crisis of 2007-2008, policymakers used
(Multiple Choice)
4.9/5 (34)
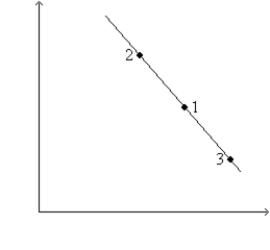
Figure 35-6
Use the graph below to answer the following questions.  -Refer to Figure 35-6. The money supply growth rate is greatest at
(Multiple Choice)
4.9/5 (44)
If inflation expectations decline, then the short-run Phillips curve shifts
(Multiple Choice)
4.8/5 (34)
Filters
- Essay(0)
- Multiple Choice(0)
- Short Answer(0)
- True False(0)
- Matching(0)