Exam 8: Sampling Distributions
Exam 1: What Is Statistics39 Questions
Exam 2: Graphical and Tabular Descriptive Techniques192 Questions
Exam 3: Numerical Descriptive Techniques215 Questions
Exam 4: Data Collection and Sampling82 Questions
Exam 5: Probability200 Questions
Exam 6: Random Variables and Discrete Probability Distributions158 Questions
Exam 7: Continuous Probability Distributions149 Questions
Exam 8: Sampling Distributions127 Questions
Exam 9: Introduction to Estimation85 Questions
Exam 10: Introduction to Hypothesis Testing178 Questions
Exam 11: Inference About a Population75 Questions
Exam 12: Inference About Comparing Two Populations, Part 183 Questions
Exam 13: Inference About Comparing Two Populations, Part 284 Questions
Exam 14: Analysis of Variance125 Questions
Exam 15: Chi-Squared Tests118 Questions
Exam 16: Simple Linear Regression and Correlation231 Questions
Exam 17: Multiple Regression143 Questions
Exam 18: Review of Statistical Inference182 Questions
Select questions type
Number of Fish Tanks: The following data give the number of fish tanks owned for a population of 4 families.
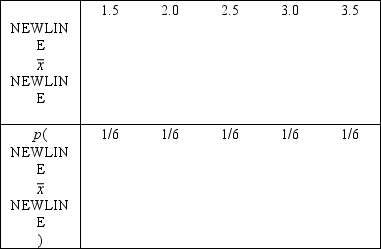
 -Find the sampling distribution of
  , and use it to calculate the mean and the standard deviation of
  .
.
Free
(Essay)
4.8/5  (36)
(36)
Correct Answer: Verified
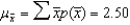 , and
, and 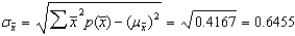
The variance of  is ____________________.
Free
(Short Answer)
4.8/5 (36)
Correct Answer:Verified

Retirees: A sample of 50 retirees is drawn at random from a normal population whose mean age and standard deviation are 75 and 6 years, respectively.
-What is the probability that the mean age is at most 73 years?
Free
(Essay)
4.9/5 (29)
Correct Answer:Verified
P(  73) = 0.0091
In general, the binomial probability P(X = x) is approximated by the area under a normal curve between x- .5 and x + .5.
(True/False)
4.7/5 (32)
Mean Salary: In order to estimate the mean salary for a population of 500 employees, the president of a certain company selected at random a sample of 40 employees.
-If the population standard deviation is $800, compute the standard error both with and without using the finite population correction factor.
(Essay)
4.9/5 (39)
Average Annual Revenue
Suppose that the average annual revenue of a small business is $150,000 with a standard deviation of $40,000. Assume that the revenue distribution is normal.
-{Average Annual Revenue Narrative} What is the probability that the average annual revenue of a random sample of 4 businesses is less than $120,000?
(Short Answer)
4.8/5 (31)
A sample of size 25 is selected from a population of size 75. The finite population correction needed to find the standard error of  .
.
(True/False)
4.8/5 (36)
The continuity correction factor adds and subtracts the number ____________________ to/from x to find P(X = x).
(Short Answer)
4.7/5 (28)
The standard deviation of the sampling distribution of  is also called the:
(Multiple Choice)
4.9/5 (40)
If a simple random sample of 300 observations is taken from a population whose proportion p = 0.6, then the expected value of the sample proportion  is 0.60.
(True/False)
4.8/5 (42)
If all possible samples of size n are drawn from a normal population, the probability distribution of the sample mean  is an exact normal distribution.
(True/False)
4.8/5 (34)
Heights of Fences
Heights of fences are normally distributed with a mean of 52 inches and a standard deviation of 4 inches.
-{Heights of Fences Narrative} Find the probability that one randomly selected fence is under 54 inches.
(Short Answer)
4.9/5 (31)
Heights of Men
The heights of men in the USA are normally distributed with a mean of 68 inches and a standard deviation of 4 inches.
-{Heights of Men Narrative} If the population of men's heights is not normally distributed, which, if any, of the previous questions can you answer?
(Essay)
4.8/5 (37)
Heights of Fences
Heights of fences are normally distributed with a mean of 52 inches and a standard deviation of 4 inches.
-{Heights of Fence Narrative} Find the probability that the mean height of 4 randomly selected fences is under 54 inches.
(Short Answer)
4.8/5 (41)
The finite population correction is not needed if the population size is large relative to the sample size. As a rule of thumb, we will treat any population that is at least ____________________ times larger than the sample size as large.
(Short Answer)
4.7/5 (32)
Suppose that the probability p of success on any trail of a binomial distribution equals 0.90. Then for which of the following number of trials, n, would the normal distribution provide a good approximation to the binomial distribution?
(Multiple Choice)
4.8/5 (39)
Number of Fish Tanks: The following data give the number of fish tanks owned for a population of 4 families.
-List all possible samples of 2 families that can be selected without replacement from this population, and compute the sample mean  for each sample.
(Essay)
4.9/5 (30)
The standard error of the sampling distribution of the sample proportion  , when the sample size n = 100 and the population proportion p = 0.30, is 0.0021.
(True/False)
4.9/5 (42)
Filters
- Essay(0)
- Multiple Choice(0)
- Short Answer(0)
- True False(0)
- Matching(0)