Exam 2: Graphical and Tabular Descriptive Techniques
Exam 1: What Is Statistics39 Questions
Exam 2: Graphical and Tabular Descriptive Techniques192 Questions
Exam 3: Numerical Descriptive Techniques215 Questions
Exam 4: Data Collection and Sampling82 Questions
Exam 5: Probability200 Questions
Exam 6: Random Variables and Discrete Probability Distributions158 Questions
Exam 7: Continuous Probability Distributions149 Questions
Exam 8: Sampling Distributions127 Questions
Exam 9: Introduction to Estimation85 Questions
Exam 10: Introduction to Hypothesis Testing178 Questions
Exam 11: Inference About a Population75 Questions
Exam 12: Inference About Comparing Two Populations, Part 183 Questions
Exam 13: Inference About Comparing Two Populations, Part 284 Questions
Exam 14: Analysis of Variance125 Questions
Exam 15: Chi-Squared Tests118 Questions
Exam 16: Simple Linear Regression and Correlation231 Questions
Exam 17: Multiple Regression143 Questions
Exam 18: Review of Statistical Inference182 Questions
Select questions type
A skewed histogram is one with a long tail extending either to the right or left.
Free
(True/False)
5.0/5  (38)
(38)
Correct Answer: Verified
False
Observations that are measured at the same time are called ____________________ data.
Free
(Short Answer)
4.8/5 (37)
Correct Answer:Verified
cross-sectional
cross sectional
Electronics Company: At a meeting of regional offices managers of a national electronics company, a survey was taken to determine the number of employees the regional managers supervise in the operation of their departments. The results of the survey are shown below.
 -How many regional offices are represented in the survey results?
Free
(Essay)
4.7/5 (42)
Correct Answer:Verified
7 + 11 + 14 + 8 + 10 = 50
Which of the following statements describe(s) the line chart below? 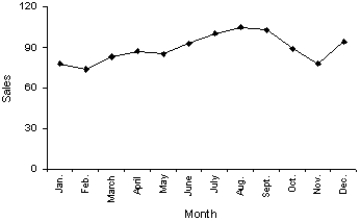
(Multiple Choice)
4.7/5 (31)
In purchasing an automobile, there are a number of variables to consider. The body style of the car (sedan, coupe, wagon, etc.) is an example of a(n) ____________________ variable.
(Short Answer)
4.8/5 (40)
A(n) ____________________ chart is not able to show frequencies. It can only show relative frequencies.
(Short Answer)
4.9/5 (39)
Interval data, such as heights, weights, and incomes, are also referred to as quantitative or numerical data.
(True/False)
4.9/5 (34)
Car buyers were asked to indicate the car dealer they believed offered the best overall service. The four choices were Convoy Motors (C), Mako Chrysler (M), Torrent Auto (T), and Unequaled Chevrolet (U). The following data were obtained:  What percentage of car buyers identified Convoy Motors as having the best overall service?
(Multiple Choice)
4.9/5 (36)
For what type of data are frequencies the only calculations that can be done?
(Multiple Choice)
4.9/5 (43)
Which of the following describes the shape of the histogram below? 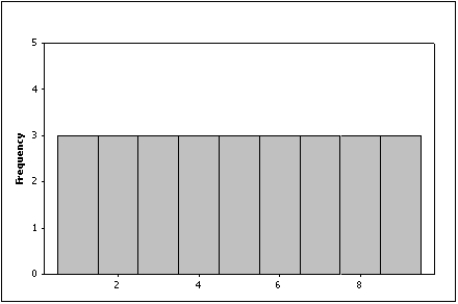
(Multiple Choice)
4.9/5 (27)
The two most important characteristics to examine in a scatter diagram are the number of possible categories for X and Y and the number of observations in each category.
(True/False)
4.9/5 (40)
Insurance Company: A representative from a local insurance agency selected a random sample of insured homeowners and recorded the number of claims made in the last three years, with the following results:
 -What proportion of homeowners had no claims in the last three years?
(Essay)
4.8/5 (32)
The two most important characteristics to look for in a scatter diagram are the ____________________ and ____________________ of the linear relationship.
(Short Answer)
4.9/5 (37)
The number of class intervals in a histogram depends on the number of observations in the data set.
(True/False)
4.9/5 (34)
A professor examines the relationship between minutes studying and exam score (out of 200 points) for a random sample of his students. The scatter diagram is shown below. It appears that study time has somewhat of a positive linear relationship with exam score. 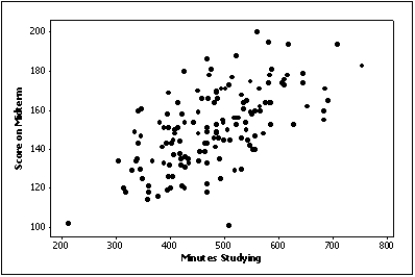
(True/False)
4.9/5 (34)
According to the stem-and-leaf plot below, the median quiz score for this data set is 8.

(True/False)
4.7/5 (38)
Filters
- Essay(0)
- Multiple Choice(0)
- Short Answer(0)
- True False(0)
- Matching(0)