Exam 10: Data Mining
Exam 1: Introduction to Modeling and Decision Analysis78 Questions
Exam 2: Introduction to Optimization and Linear Programming76 Questions
Exam 3: Modeling and Solving Lp Problems in a Spreadsheet93 Questions
Exam 4: Sensitivity Analysis and the Simplex Method76 Questions
Exam 5: Network Modeling92 Questions
Exam 6: Integer Linear Programming102 Questions
Exam 7: Goal Programming and Multiple Objective Optimization81 Questions
Exam 8: Nonlinear Programming Evolutionary Optimization87 Questions
Exam 9: Regression Analysis93 Questions
Exam 10: Data Mining125 Questions
Exam 11: Time Series Forecasting125 Questions
Exam 12: Introduction to Simulation Using Analytic Solver Platform85 Questions
Exam 13: Queuing Theory97 Questions
Exam 14: Decision Analysis125 Questions
Exam 15: Project Management Online82 Questions
Select questions type
A ______________ provides a visual summary of the improvements that a data mining project provides on a binary classification problem compared to a random guess
(Multiple Choice)
4.8/5  (37)
(37)
Exhibit 10.3
The information below is used for the following questions.
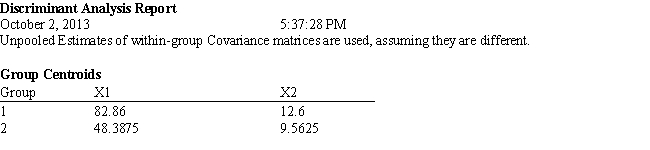
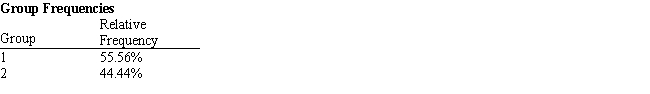
A loan officer wants to determine if people will be late in making loan payments. She has information of 18 current loans including the applicants income, level of assets and whether or not the person has been late on payments. She has performed an analysis on the data and obtained the output shown below. 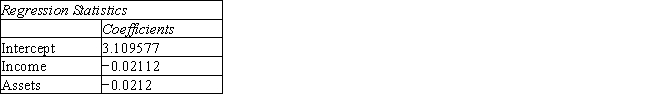
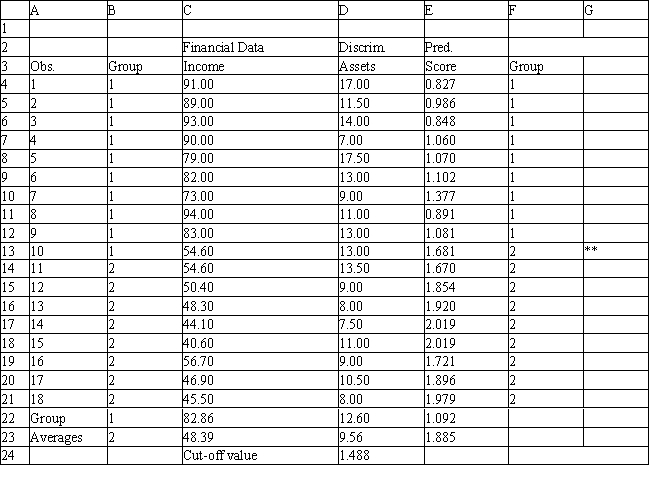
-Refer to Exhibit 10.3. Compute the discriminant score and predicted group for someone with an income of 65 and assets of 11.
-Refer to Exhibit 10.3. Compute the discriminant score and predicted group for someone with an income of 65 and assets of 11.
(Essay)
4.8/5 (41)
Suppose that a data set contains a variable EDUCATION, which has 7 discrete levels. EDUCATION can be represented by ____ binary variables
(Multiple Choice)
4.9/5 (37)
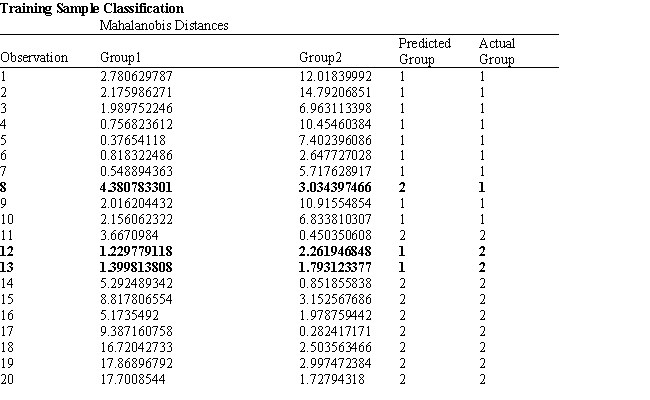
Exhibit 10.1
The following questions are based on the problem description and the output below.
A college admissions officer wants to evaluate graduate school applicants based on their GMAT scores, verbal and quantitative. Students are classified as either successful or not-successful in their graduate studies. The officer has data on 20 current students, ten of whom are doing very well (Group 1) and ten who are not (Group 2). 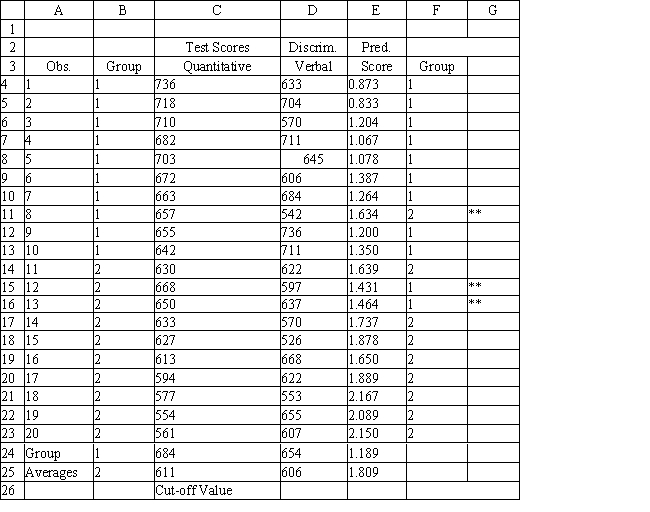


 -Refer to Exhibit 10.1. What is the straight line distance between (6,4) and (2,9)?
(Multiple Choice)
4.9/5 (18)
In hierarchical clustering, the measure of similarity between clusters is/are
(Multiple Choice)
4.9/5 (34)
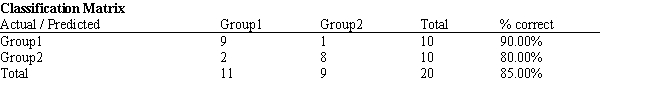
Exhibit 10.1
The following questions are based on the problem description and the output below.
A college admissions officer wants to evaluate graduate school applicants based on their GMAT scores, verbal and quantitative. Students are classified as either successful or not-successful in their graduate studies. The officer has data on 20 current students, ten of whom are doing very well (Group 1) and ten who are not (Group 2).
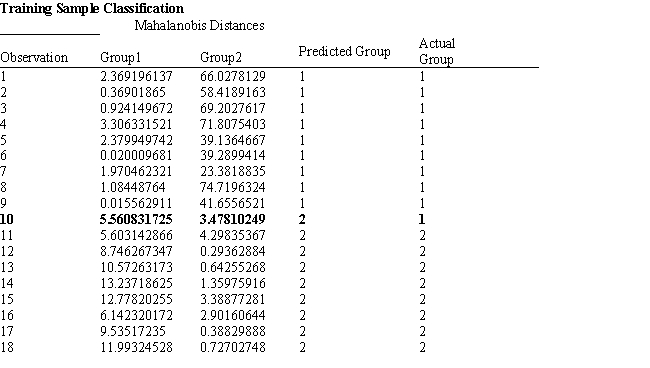
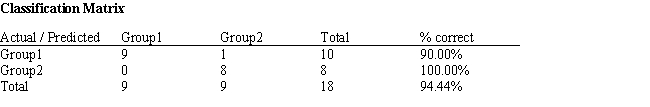
-Refer to Exhibit 10.1. What percentage of the observations is classified correctly?
(Multiple Choice)
4.7/5 (34)
___________ and _________ must be chosen each time a partition is subdivided
(Multiple Choice)
4.9/5 (34)
In discriminant analysis the averages for the independent variables for a group define the
(Multiple Choice)
4.7/5 (30)
Technique(s) used in prediction step of data mining include
(Multiple Choice)
4.9/5 (29)
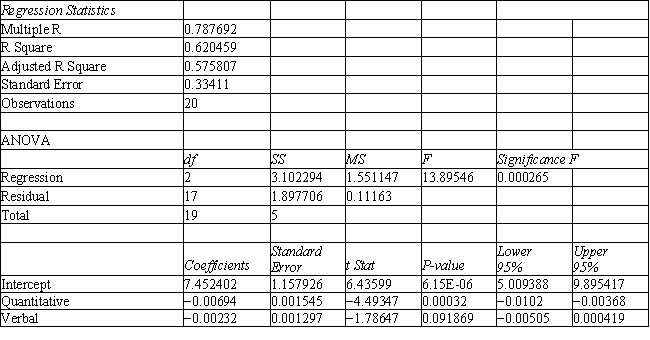
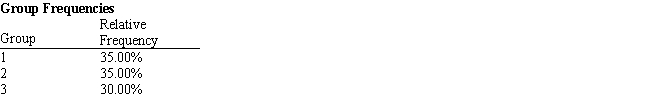
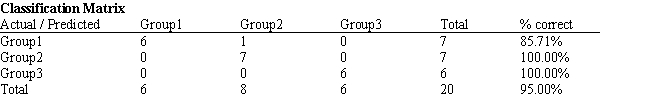
Exhibit 10.2
The following questions are based on the problem description and the output below.
A college admissions officer wants to evaluate graduate school applicants based on their GMAT scores, verbal and quantitative. Students are classified as either successful (Group 1), marginally successful (Group 2) or not-successful (Group 3) in their graduate studies. The officer has data on 20 current students, 7 successful (Group 1), 6 marginally successful (Group 2) and 7 not successful (Group 3). 
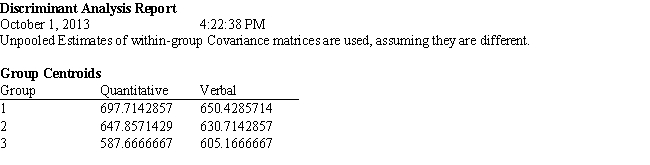

 -Refer to Exhibit 10.2. What is the verbal test score value of the group centroid for group 3?
(Multiple Choice)
4.8/5 (38)
Exhibit 10.2
The following questions are based on the problem description and the output below.
A college admissions officer wants to evaluate graduate school applicants based on their GMAT scores, verbal and quantitative. Students are classified as either successful (Group 1), marginally successful (Group 2) or not-successful (Group 3) in their graduate studies. The officer has data on 20 current students, 7 successful (Group 1), 6 marginally successful (Group 2) and 7 not successful (Group 3). 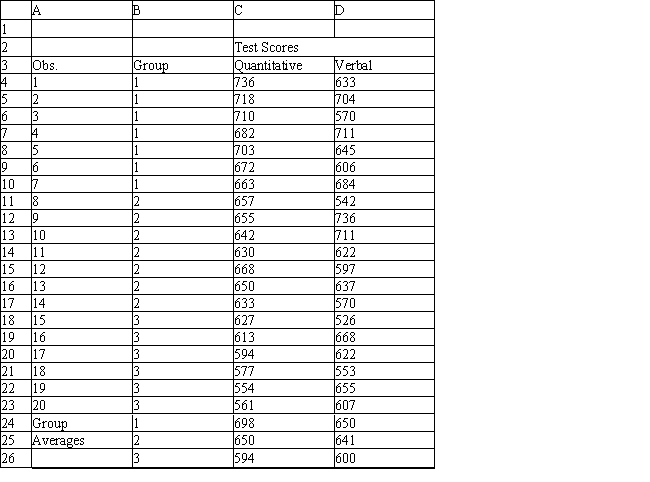


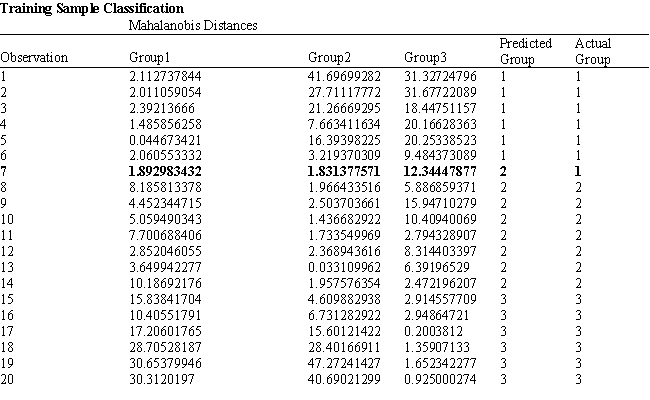
 -Refer to Exhibit 10.2. What is the verbal test score value of the group centroid for group 1?
(Multiple Choice)
4.9/5 (35)
The k-nearest neighbor (k-NN) technique identifies the k observations in the training data that are most similar (or nearest) to a new observation we want to classify.
(True/False)
4.9/5 (39)
Plots useful in data mining analysis can be accessed in Excel using the _______ add-in
(Multiple Choice)
4.9/5 (36)
Exhibit 10.1
The following questions are based on the problem description and the output below.
A college admissions officer wants to evaluate graduate school applicants based on their GMAT scores, verbal and quantitative. Students are classified as either successful or not-successful in their graduate studies. The officer has data on 20 current students, ten of whom are doing very well (Group 1) and ten who are not (Group 2). 

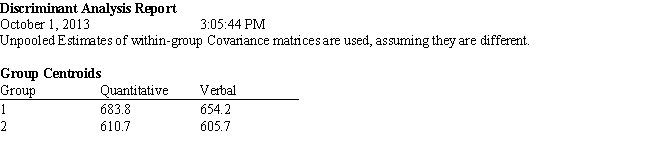
 -Refer to Exhibit 10.1. What is the verbal test score value of the group centroid for group 2?
(Multiple Choice)
4.9/5 (28)
In hierarchical clustering, the measure of similarity between clusters is/are
(Multiple Choice)
4.9/5 (31)
Filters
- Essay(0)
- Multiple Choice(0)
- Short Answer(0)
- True False(0)
- Matching(0)