Exam 10: Data Mining
Exam 1: Introduction to Modeling and Decision Analysis78 Questions
Exam 2: Introduction to Optimization and Linear Programming76 Questions
Exam 3: Modeling and Solving Lp Problems in a Spreadsheet93 Questions
Exam 4: Sensitivity Analysis and the Simplex Method76 Questions
Exam 5: Network Modeling92 Questions
Exam 6: Integer Linear Programming102 Questions
Exam 7: Goal Programming and Multiple Objective Optimization81 Questions
Exam 8: Nonlinear Programming Evolutionary Optimization87 Questions
Exam 9: Regression Analysis93 Questions
Exam 10: Data Mining125 Questions
Exam 11: Time Series Forecasting125 Questions
Exam 12: Introduction to Simulation Using Analytic Solver Platform85 Questions
Exam 13: Queuing Theory97 Questions
Exam 14: Decision Analysis125 Questions
Exam 15: Project Management Online82 Questions
Select questions type
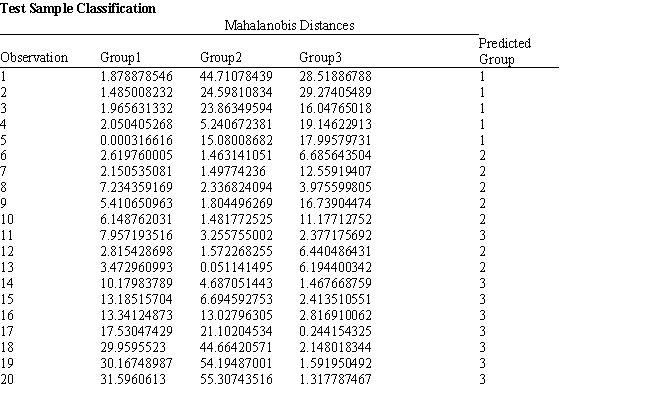
Exhibit 10.2
The following questions are based on the problem description and the output below.
A college admissions officer wants to evaluate graduate school applicants based on their GMAT scores, verbal and quantitative. Students are classified as either successful (Group 1), marginally successful (Group 2) or not-successful (Group 3) in their graduate studies. The officer has data on 20 current students, 7 successful (Group 1), 6 marginally successful (Group 2) and 7 not successful (Group 3). 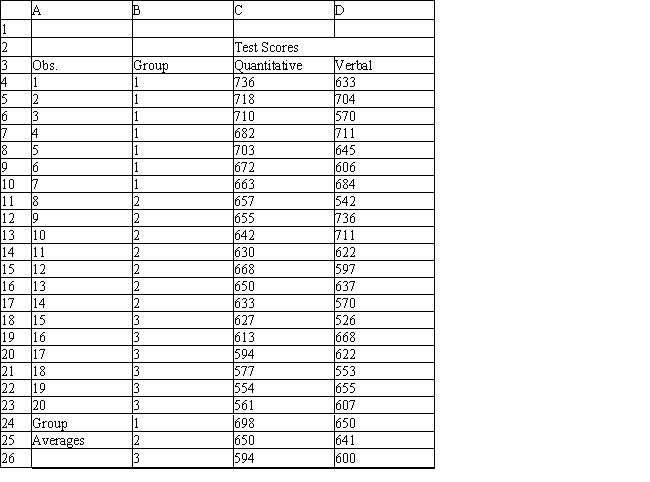
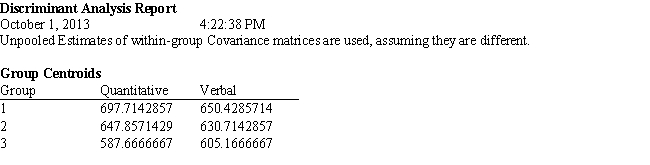

 -Refer to Exhibit 10.2. What is the quantitative test score value of the group centroid for group 1?
(Multiple Choice)
4.9/5  (36)
(36)
Exhibit 10.5
The information below is used for the following questions.
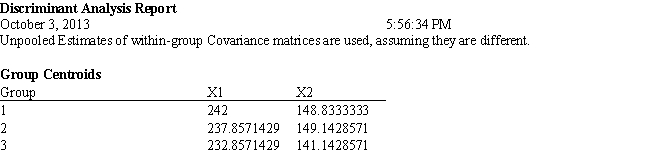
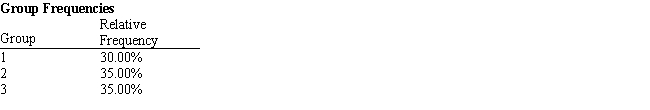
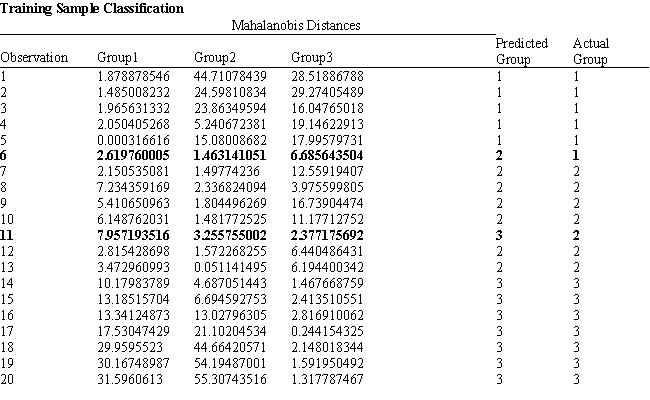
A counselor wants to classify people as belonging to one of three groups based on two scores. The counselor has collected data on twenty people who are known to be in one of the three groups. The data for the problem are in the following spreadsheet. Relevant output is also included. 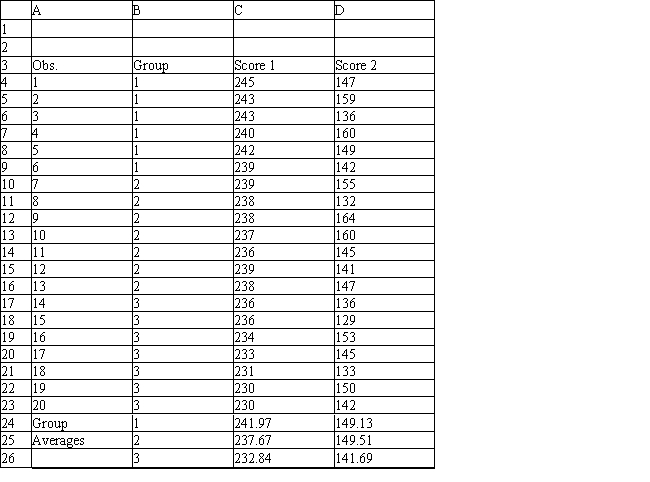
-Refer to Exhibit 10.5. What formulas should go in cells C24:D26 of the spreadsheet?
-Refer to Exhibit 10.5. What formulas should go in cells C24:D26 of the spreadsheet?
(Essay)
4.8/5 (40)
If using the regression tool for two-group discriminant analysis, in the regression dialog box, the Input X-Range entry corresponds to
(Multiple Choice)
4.9/5 (34)
Exhibit 10.6
The information below is used for the following questions.
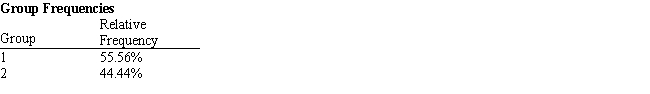
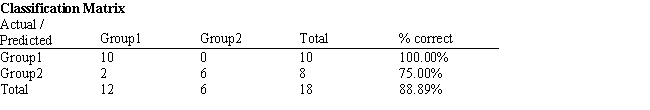
An investor wants to classify companies as being either a good investment, Group 1, or a poor investment, Group 2. He has gathered Liquidity, Profitability and Activity data on 18 companies he has invested in and run a regression analysis. Discriminant Analysis output has also been generated. The data for the problem and the relevant output are shown below. 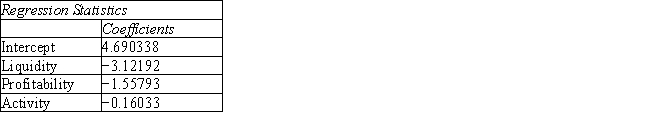
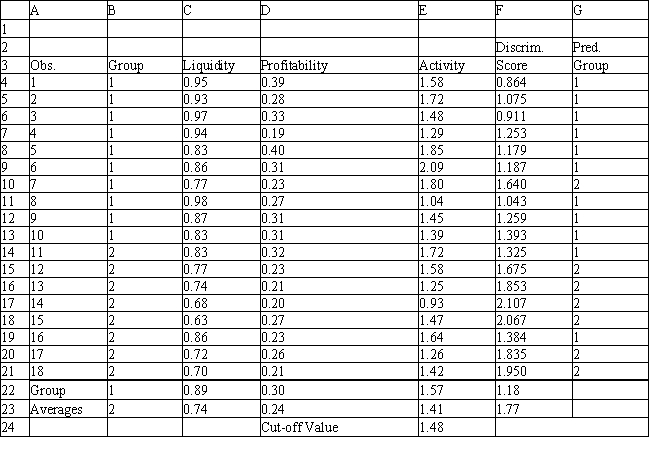
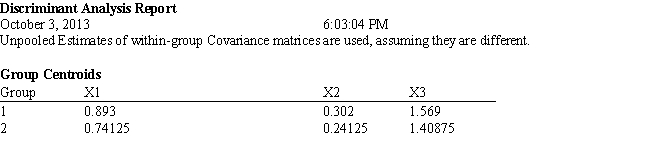
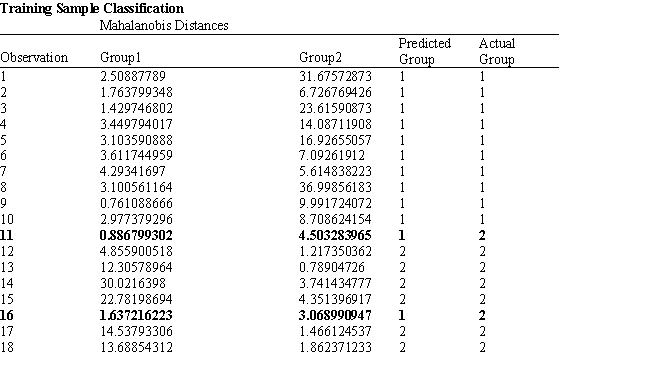
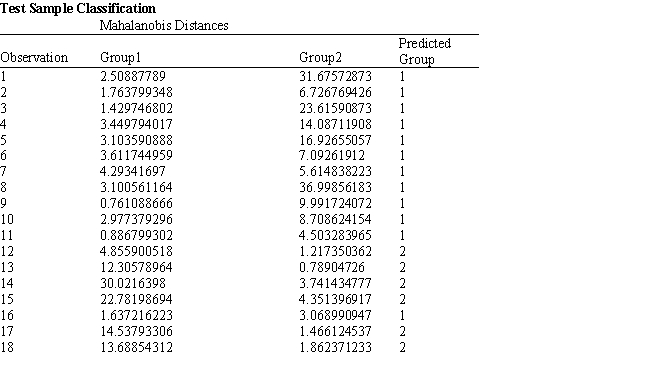 -Refer to Exhibit 10.6. Compute the discriminant score and predicted group for a company with Liquidity = 0.91, Profitability = 0.32 and Activity = 1.39.
(Essay)
4.8/5 (35)
Suppose the Fisher classification scores for an observation have been converted to the following probabilities: (i) 0.6 for Group 1 and (ii) 0.4 for Group 2. The observation will be classified to
(Multiple Choice)
4.7/5 (32)
Filters
- Essay(0)
- Multiple Choice(0)
- Short Answer(0)
- True False(0)
- Matching(0)