Exam 10: Data Mining
Exam 1: Introduction to Modeling and Decision Analysis78 Questions
Exam 2: Introduction to Optimization and Linear Programming76 Questions
Exam 3: Modeling and Solving Lp Problems in a Spreadsheet93 Questions
Exam 4: Sensitivity Analysis and the Simplex Method76 Questions
Exam 5: Network Modeling92 Questions
Exam 6: Integer Linear Programming102 Questions
Exam 7: Goal Programming and Multiple Objective Optimization81 Questions
Exam 8: Nonlinear Programming Evolutionary Optimization87 Questions
Exam 9: Regression Analysis93 Questions
Exam 10: Data Mining125 Questions
Exam 11: Time Series Forecasting125 Questions
Exam 12: Introduction to Simulation Using Analytic Solver Platform85 Questions
Exam 13: Queuing Theory97 Questions
Exam 14: Decision Analysis125 Questions
Exam 15: Project Management Online82 Questions
Select questions type
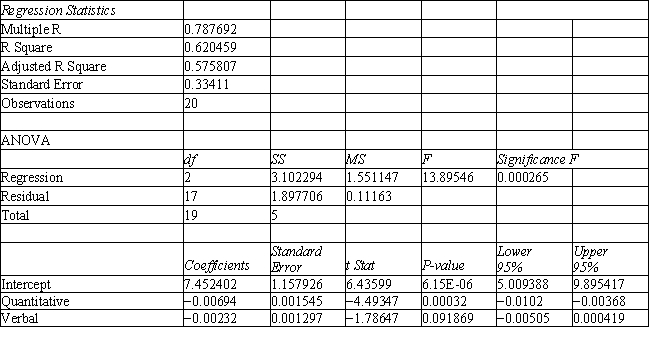
Exhibit 10.1
The following questions are based on the problem description and the output below.
A college admissions officer wants to evaluate graduate school applicants based on their GMAT scores, verbal and quantitative. Students are classified as either successful or not-successful in their graduate studies. The officer has data on 20 current students, ten of whom are doing very well (Group 1) and ten who are not (Group 2). 


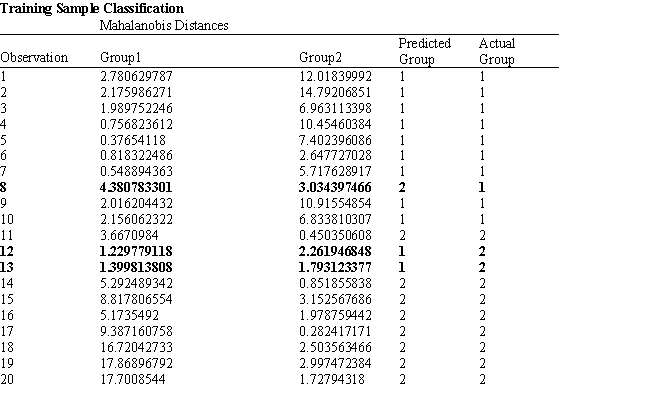 -Refer to Exhibit 10.1. Suppose that for a given observation, the difference between Mahalanobis distances between group 1 and 2 (G1-G2) is big and negative. This means that
(Multiple Choice)
4.9/5  (31)
(31)
To create the training and validation data set for the model use the __________ option in the XLMiner tab
(Multiple Choice)
4.9/5 (26)
Technique(s) used in classification step of data mining include
(Multiple Choice)
4.7/5 (30)
The Mahalanobis distance measure accounts for differences in the covariances between all possible pairings of the independent variables.
(True/False)
4.9/5 (31)
In the ________ step of data mining, a researcher attempts to predict the value of a continuous response variable based on the data set
(Multiple Choice)
4.9/5 (36)
One element in cleaning the data set in the mining process involves
(Multiple Choice)
4.8/5 (42)
If using the regression tool for two-group discriminant analysis, in the regression dialog box, the Input Y-Range entry corresponds to
(Multiple Choice)
4.9/5 (36)
Suppose that all observations belong to the same class. The entropy measure for this situation is equal to
(Multiple Choice)
4.8/5 (34)
A graphical representation of a set of rules for classifying observations into 2 or more groups is called
(Multiple Choice)
4.8/5 (34)
Suppose that the correlation coefficient between X1 and X2 is equal to 1. This means that
(Multiple Choice)
5.0/5 (32)
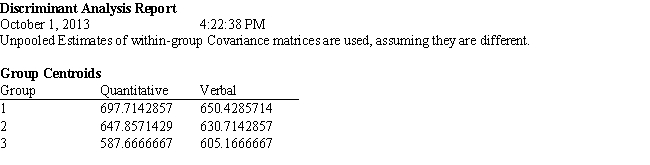
Exhibit 10.2
The following questions are based on the problem description and the output below.
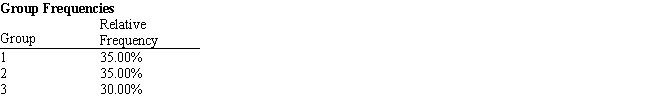
A college admissions officer wants to evaluate graduate school applicants based on their GMAT scores, verbal and quantitative. Students are classified as either successful (Group 1), marginally successful (Group 2) or not-successful (Group 3) in their graduate studies. The officer has data on 20 current students, 7 successful (Group 1), 6 marginally successful (Group 2) and 7 not successful (Group 3). 


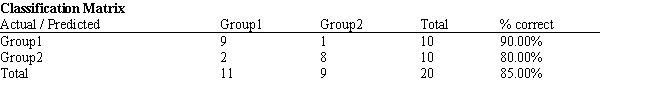
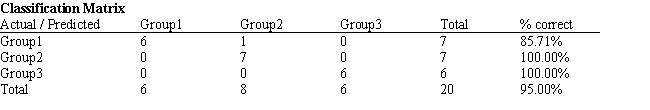 -Refer to Exhibit 10.2. Based on the analysis presented in the spreadsheet, what percentage of the observations were correctly classified?
(Multiple Choice)
4.7/5 (35)
Which of the following is not true regarding discriminant analysis?
(Multiple Choice)
4.9/5 (38)
Exhibit 10.2
The following questions are based on the problem description and the output below.
A college admissions officer wants to evaluate graduate school applicants based on their GMAT scores, verbal and quantitative. Students are classified as either successful (Group 1), marginally successful (Group 2) or not-successful (Group 3) in their graduate studies. The officer has data on 20 current students, 7 successful (Group 1), 6 marginally successful (Group 2) and 7 not successful (Group 3). 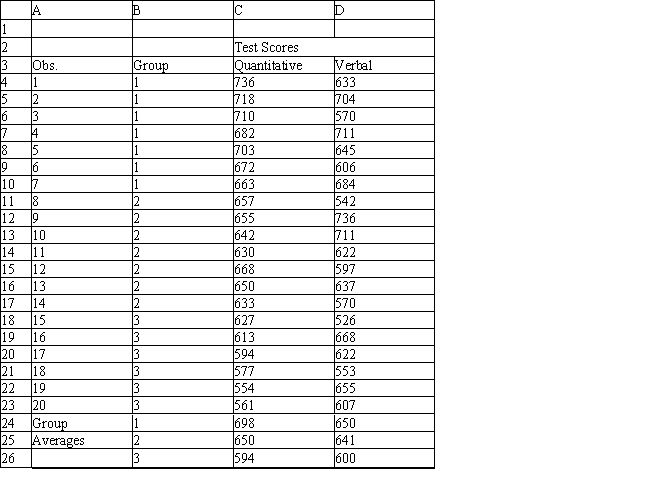

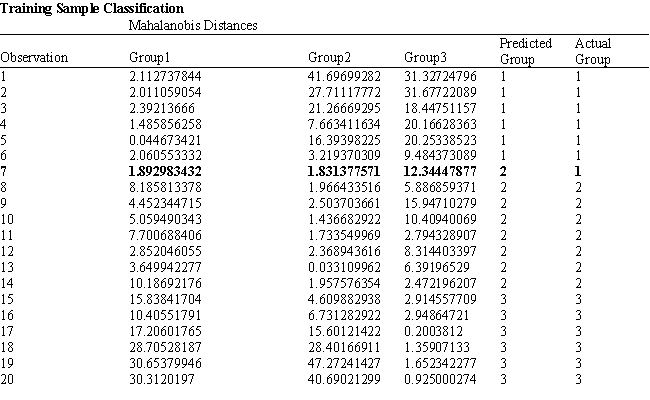
 -Refer to Exhibit 10.2. What number of observations is classified correctly?
(Multiple Choice)
4.8/5 (34)
Exhibit 10.1
The following questions are based on the problem description and the output below.
A college admissions officer wants to evaluate graduate school applicants based on their GMAT scores, verbal and quantitative. Students are classified as either successful or not-successful in their graduate studies. The officer has data on 20 current students, ten of whom are doing very well (Group 1) and ten who are not (Group 2). 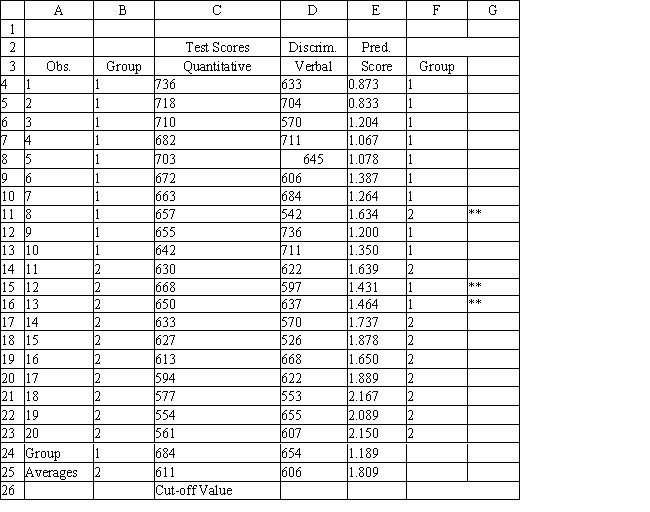

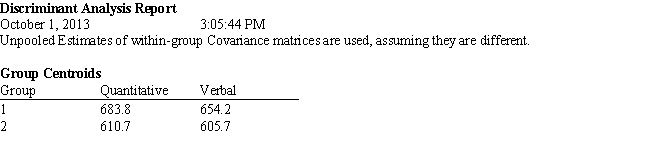
 -Refer to Exhibit 10.1. The university has received applications from several new students and would like to predict which group they would fall into. What is the discriminant score for a student with a Quantitative score of 686 and a Verbal score of 601. Use five (5) significant figures in your coefficients.
(Multiple Choice)
4.9/5 (22)
Given the following confusion matrix 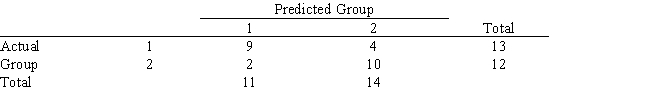 what is the correct classification rate?
(Multiple Choice)
4.8/5 (38)
Filters
- Essay(0)
- Multiple Choice(0)
- Short Answer(0)
- True False(0)
- Matching(0)