Exam 10: Data Mining
Exam 1: Introduction to Modeling and Decision Analysis78 Questions
Exam 2: Introduction to Optimization and Linear Programming76 Questions
Exam 3: Modeling and Solving Lp Problems in a Spreadsheet93 Questions
Exam 4: Sensitivity Analysis and the Simplex Method76 Questions
Exam 5: Network Modeling92 Questions
Exam 6: Integer Linear Programming102 Questions
Exam 7: Goal Programming and Multiple Objective Optimization81 Questions
Exam 8: Nonlinear Programming Evolutionary Optimization87 Questions
Exam 9: Regression Analysis93 Questions
Exam 10: Data Mining125 Questions
Exam 11: Time Series Forecasting125 Questions
Exam 12: Introduction to Simulation Using Analytic Solver Platform85 Questions
Exam 13: Queuing Theory97 Questions
Exam 14: Decision Analysis125 Questions
Exam 15: Project Management Online82 Questions
Select questions type
The regression approach can be used in the two-group discriminant analysis problem because
(Multiple Choice)
4.8/5  (35)
(35)
Exhibit 10.4
The information below is used for the following questions.
A manager wants to classify people as belonging to one of two groups based on two scores. The manager has collected data on four current employees and has performed a regression analysis on the data. The data for the problem and the relevant output are shown below. 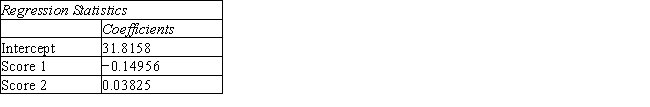

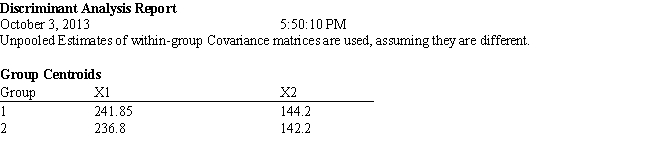

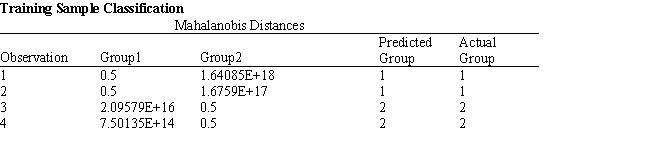

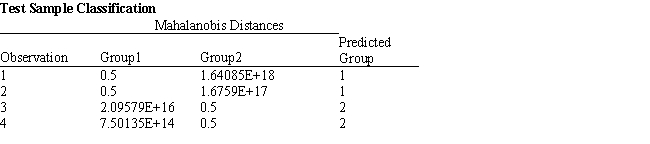 -Refer to Exhibit 10.4. Compute the discriminant score and predicted group for someone with Score 1 of 238 and Score 2 of 140.
(Essay)
4.8/5 (34)
Affinity analysis is a data mining technique that attempts to discover
(Multiple Choice)
4.8/5 (31)
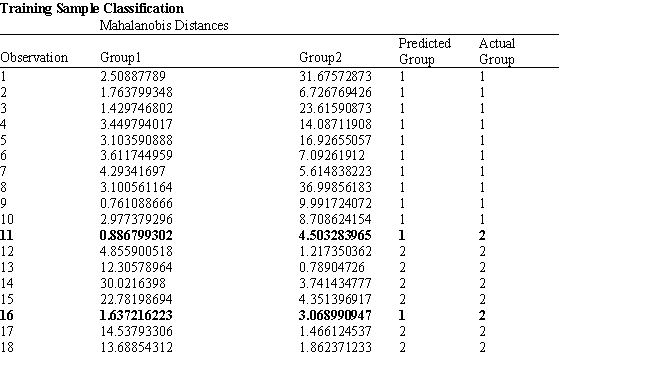
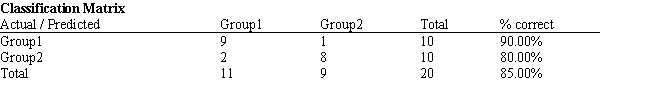
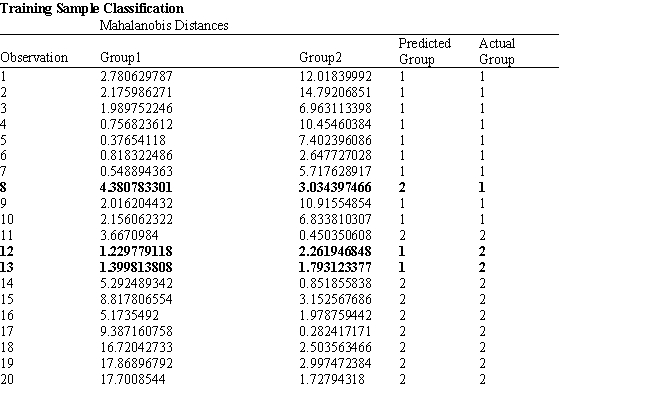
Exhibit 10.1
The following questions are based on the problem description and the output below.
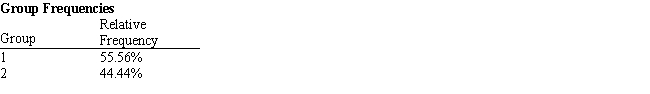
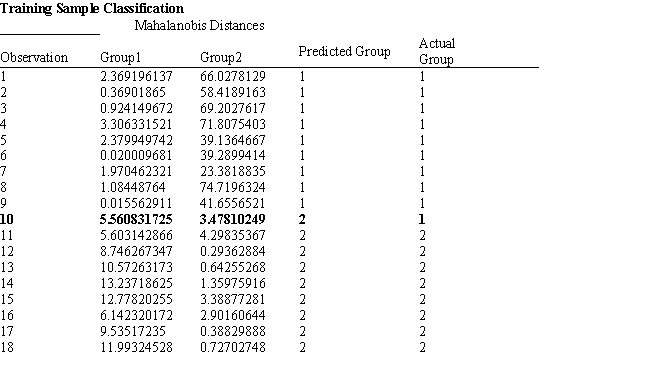
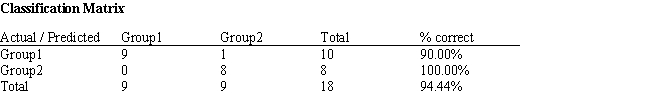
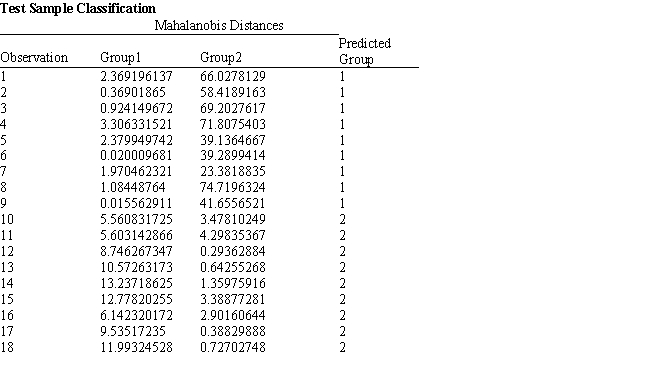
A college admissions officer wants to evaluate graduate school applicants based on their GMAT scores, verbal and quantitative. Students are classified as either successful or not-successful in their graduate studies. The officer has data on 20 current students, ten of whom are doing very well (Group 1) and ten who are not (Group 2). 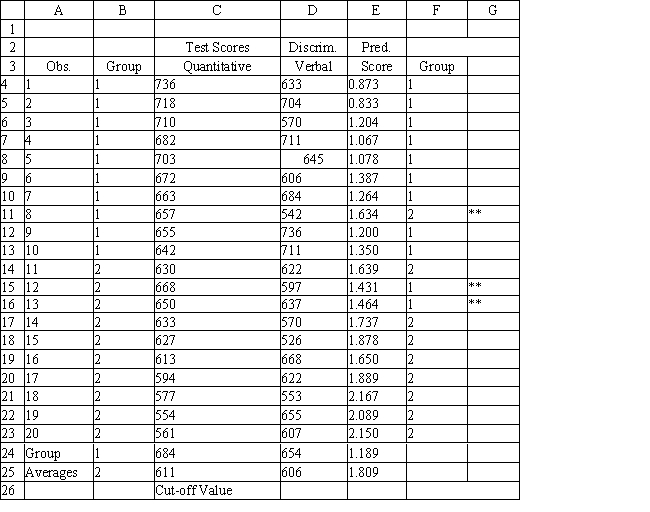


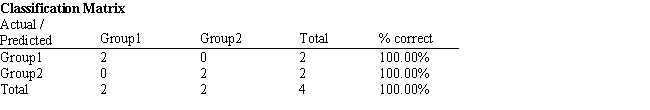
 -Refer to Exhibit 10.1. Suppose that for a given observation, the difference between Mahalanobis distances between group 1 and 2 (G1-G2) is big and positive. This means that
(Multiple Choice)
4.7/5 (37)
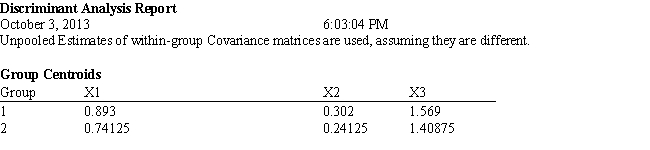
Exhibit 10.6
The information below is used for the following questions.
An investor wants to classify companies as being either a good investment, Group 1, or a poor investment, Group 2. He has gathered Liquidity, Profitability and Activity data on 18 companies he has invested in and run a regression analysis. Discriminant Analysis output has also been generated. The data for the problem and the relevant output are shown below. 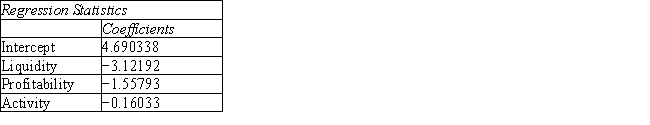
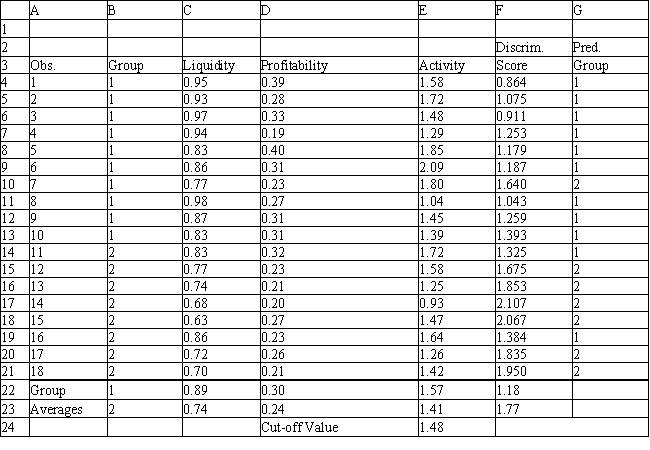

 -Refer to Exhibit 10.6. What formulas should go in cells C22:D23, E4:G24, and F24 of the spreadsheet?
(Essay)
4.9/5 (31)
Exhibit 10.4
The information below is used for the following questions.
A manager wants to classify people as belonging to one of two groups based on two scores. The manager has collected data on four current employees and has performed a regression analysis on the data. The data for the problem and the relevant output are shown below. 
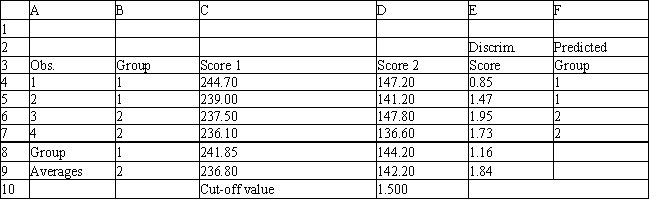


 -Refer to Exhibit 10.4. What formulas should go in cells C8:D9 and E4:G10 of the spreadsheet?
(Essay)
4.8/5 (31)
In the k nearest neighbor technique, a large value of k produces classifications that
(Multiple Choice)
4.8/5 (32)
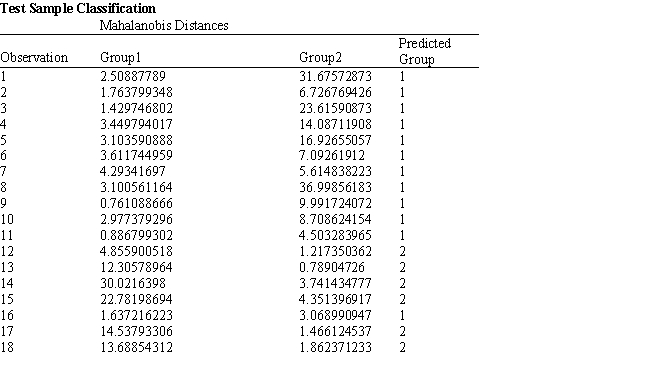
Exhibit 10.3
The information below is used for the following questions.
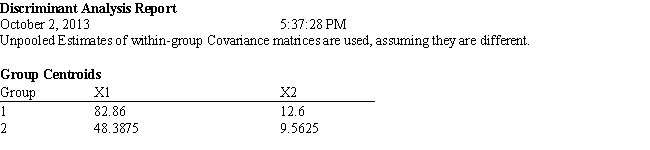
A loan officer wants to determine if people will be late in making loan payments. She has information of 18 current loans including the applicants income, level of assets and whether or not the person has been late on payments. She has performed an analysis on the data and obtained the output shown below. 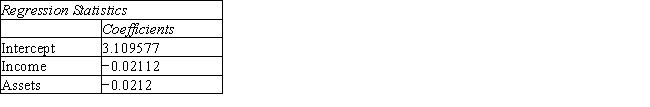
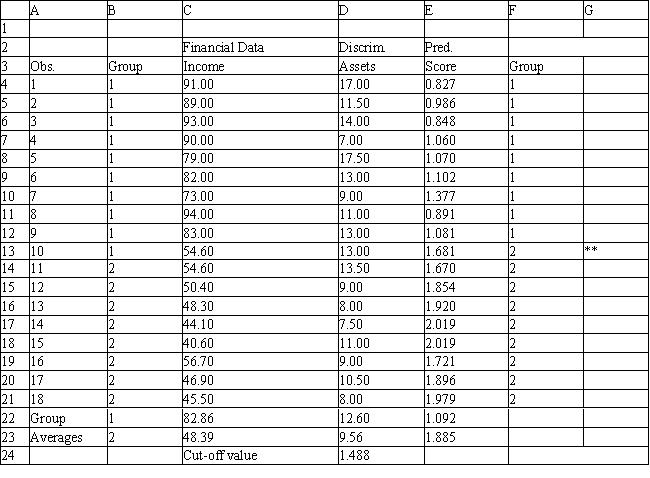
-Refer to Exhibit 10.3. What formulas should go in cells C22:D23 and E4:F24 of the spreadsheet?
-Refer to Exhibit 10.3. What formulas should go in cells C22:D23 and E4:F24 of the spreadsheet?
(Essay)
4.7/5 (31)
Suppose that there are 3 variables in a data set. Approximately how many data records are required using a rule of thumb discussed in the textbook?
(Multiple Choice)
4.9/5 (40)
The dependent variable  in the regression equation
 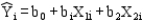 represents
(Multiple Choice)
4.8/5 (36)
Two common ways of measuring impurity are ___________ and _____________
(Multiple Choice)
4.8/5 (39)
Suppose that a data set contains a variable EDUCATION, which has 7 discrete levels. EDUCATION is an example of
(Multiple Choice)
4.8/5 (29)
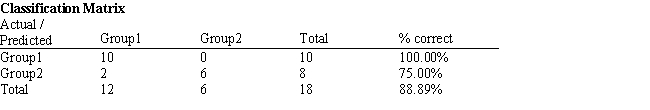
Exhibit 10.1
The following questions are based on the problem description and the output below.
A college admissions officer wants to evaluate graduate school applicants based on their GMAT scores, verbal and quantitative. Students are classified as either successful or not-successful in their graduate studies. The officer has data on 20 current students, ten of whom are doing very well (Group 1) and ten who are not (Group 2). 
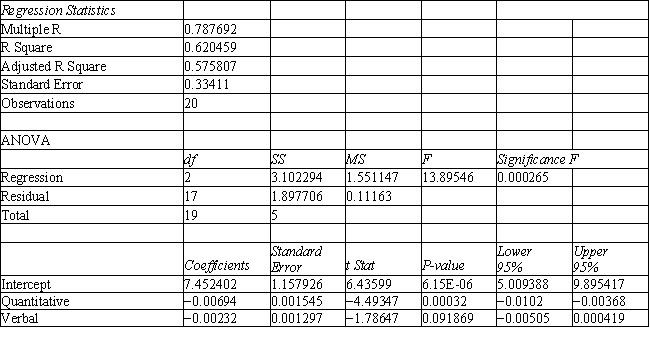
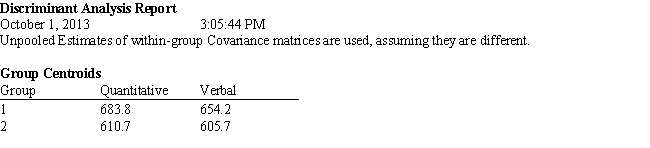
 -Refer to Exhibit 10.1. What is the quantitative test score value of the group centroid for group 2?
(Multiple Choice)
5.0/5 (37)
Filters
- Essay(0)
- Multiple Choice(0)
- Short Answer(0)
- True False(0)
- Matching(0)