Exam 10: Data Mining
Exam 1: Introduction to Modeling and Decision Analysis78 Questions
Exam 2: Introduction to Optimization and Linear Programming76 Questions
Exam 3: Modeling and Solving Lp Problems in a Spreadsheet93 Questions
Exam 4: Sensitivity Analysis and the Simplex Method76 Questions
Exam 5: Network Modeling92 Questions
Exam 6: Integer Linear Programming102 Questions
Exam 7: Goal Programming and Multiple Objective Optimization81 Questions
Exam 8: Nonlinear Programming Evolutionary Optimization87 Questions
Exam 9: Regression Analysis93 Questions
Exam 10: Data Mining125 Questions
Exam 11: Time Series Forecasting125 Questions
Exam 12: Introduction to Simulation Using Analytic Solver Platform85 Questions
Exam 13: Queuing Theory97 Questions
Exam 14: Decision Analysis125 Questions
Exam 15: Project Management Online82 Questions
Select questions type
Discriminant analysis (DA) differs from most other predictive statistical methods because the dependent variable is
(Multiple Choice)
4.8/5  (35)
(35)
Exhibit 10.6
The information below is used for the following questions.
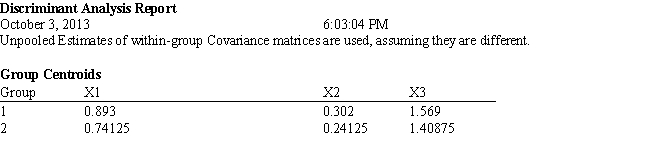
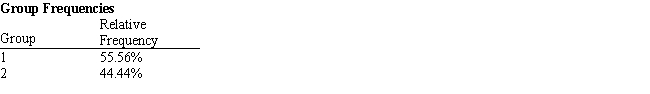
An investor wants to classify companies as being either a good investment, Group 1, or a poor investment, Group 2. He has gathered Liquidity, Profitability and Activity data on 18 companies he has invested in and run a regression analysis. Discriminant Analysis output has also been generated. The data for the problem and the relevant output are shown below. 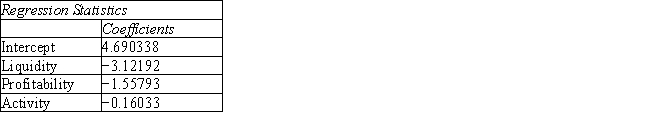
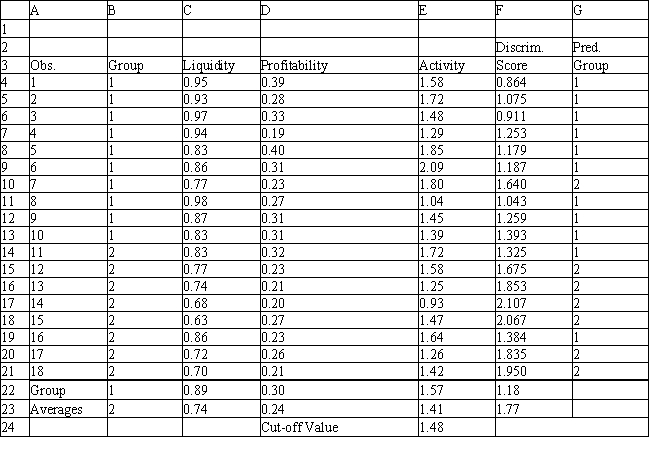
 -Refer to Exhibit 10.6. Based on the 20 observations, what percentage of the observations are correctly classified?
(Multiple Choice)
4.9/5 (37)
A classification tree is a graphical representation of a set of rules for classifying observations into one group.
(True/False)
4.8/5 (38)
The data might be normalized so that each variable is expressed on a common scale.
(True/False)
4.8/5 (30)
Suppose that all observations in partition j belong to the same group. The Gini index for this situation is equal to
(Multiple Choice)
4.9/5 (44)
Suppose that the correlation coefficient between X1 and X2 is equal to -1. This means that
(Multiple Choice)
4.9/5 (27)
Exhibit 10.1
The following questions are based on the problem description and the output below.
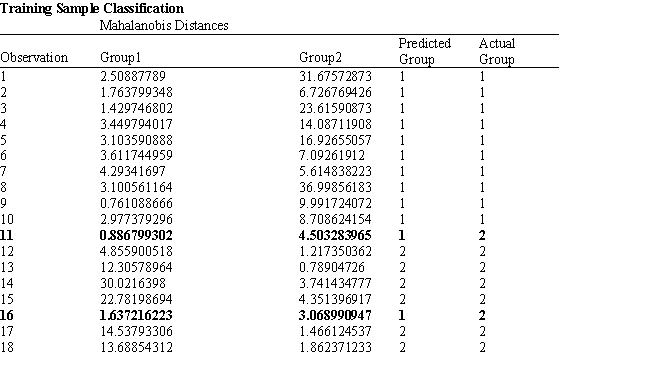
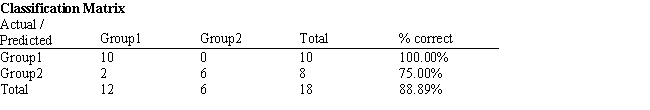
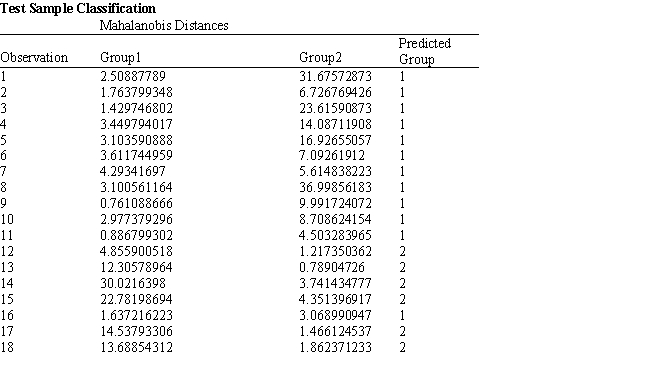
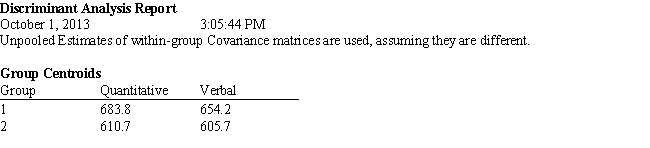
A college admissions officer wants to evaluate graduate school applicants based on their GMAT scores, verbal and quantitative. Students are classified as either successful or not-successful in their graduate studies. The officer has data on 20 current students, ten of whom are doing very well (Group 1) and ten who are not (Group 2). 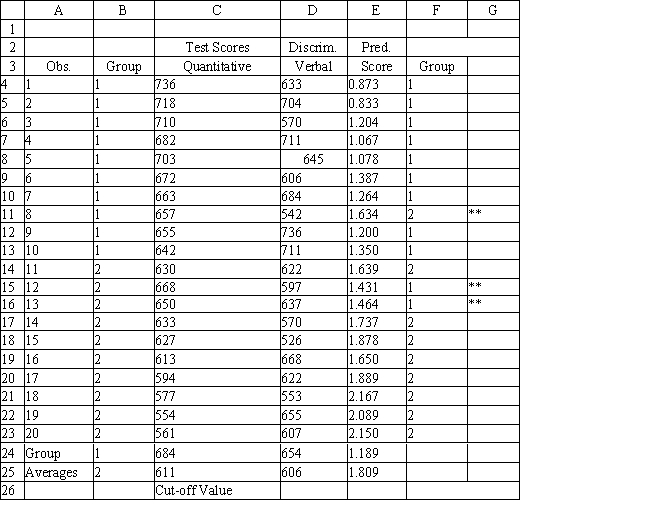
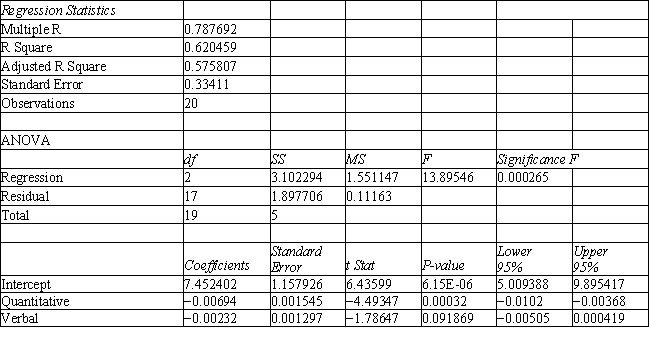


 -Refer to Exhibit 10.1. What is the verbal test score value of the group centroid for group 1?
(Multiple Choice)
4.9/5 (44)
Exhibit 10.1
The following questions are based on the problem description and the output below.
A college admissions officer wants to evaluate graduate school applicants based on their GMAT scores, verbal and quantitative. Students are classified as either successful or not-successful in their graduate studies. The officer has data on 20 current students, ten of whom are doing very well (Group 1) and ten who are not (Group 2). 

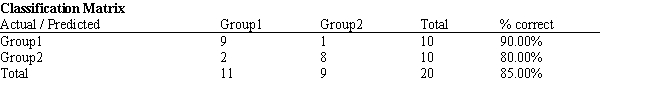
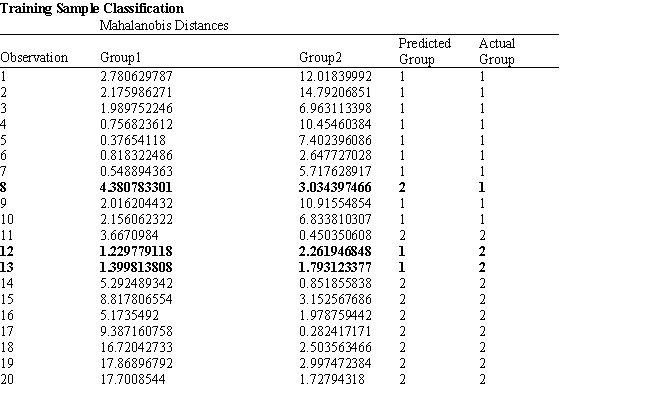 -Refer to Exhibit 10.1. What number of observations is classified incorrectly?
(Multiple Choice)
4.8/5 (36)
Logistic regression in XLMiner add-in can be used for ______ groups
(Multiple Choice)
4.8/5 (42)
Before effectively applying the k nearest neighbor classification technique, the variables need to be
(Multiple Choice)
4.7/5 (35)
A ___________ algorithm is used during the training process to adjust weights in a neural network
(Multiple Choice)
4.9/5 (20)
Technique(s) used in association step of data mining include
(Multiple Choice)
4.7/5 (43)
Steps in the data mining process include the following (in sequence)
(Multiple Choice)
4.8/5 (41)
Exhibit 10.2
The following questions are based on the problem description and the output below.
A college admissions officer wants to evaluate graduate school applicants based on their GMAT scores, verbal and quantitative. Students are classified as either successful (Group 1), marginally successful (Group 2) or not-successful (Group 3) in their graduate studies. The officer has data on 20 current students, 7 successful (Group 1), 6 marginally successful (Group 2) and 7 not successful (Group 3). 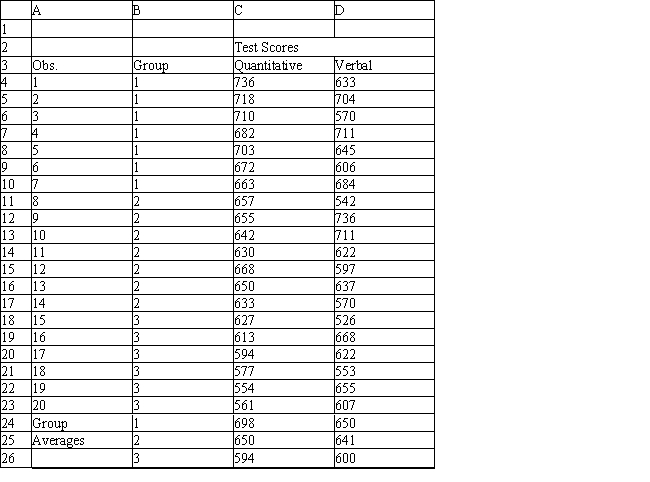
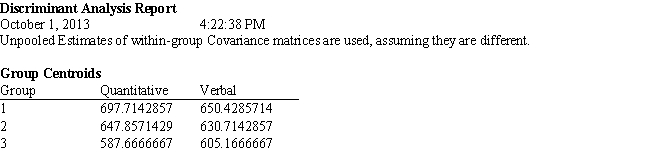
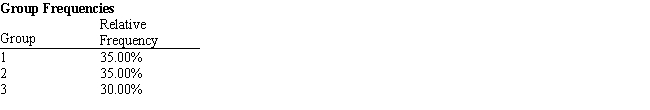
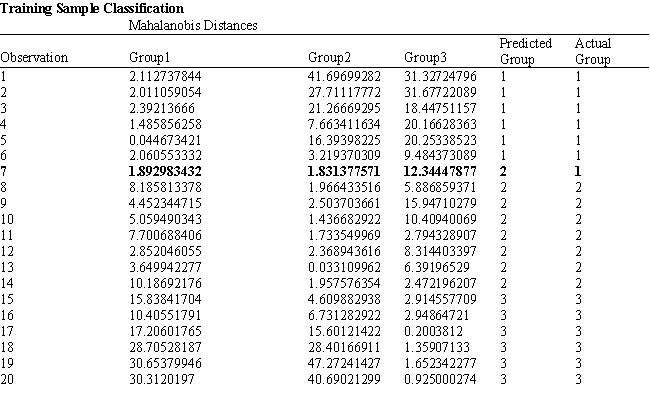
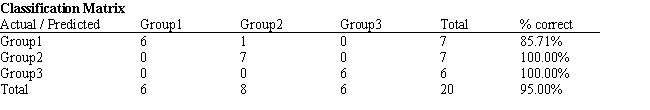 -Refer to Exhibit 10.2. What percentage of observations is classified incorrectly?
(Multiple Choice)
4.8/5 (38)
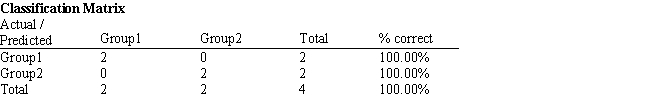
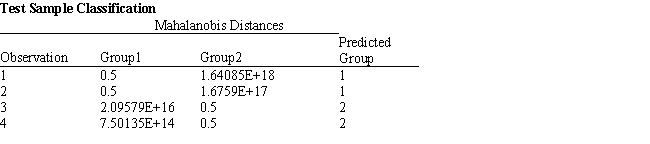
Exhibit 10.4
The information below is used for the following questions.
A manager wants to classify people as belonging to one of two groups based on two scores. The manager has collected data on four current employees and has performed a regression analysis on the data. The data for the problem and the relevant output are shown below. 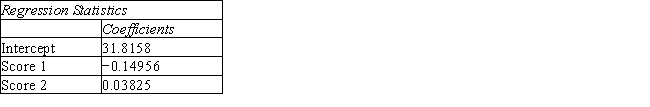
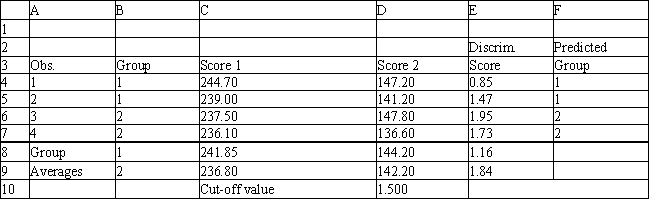
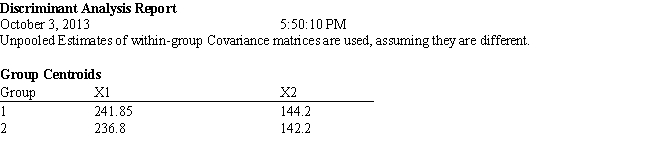

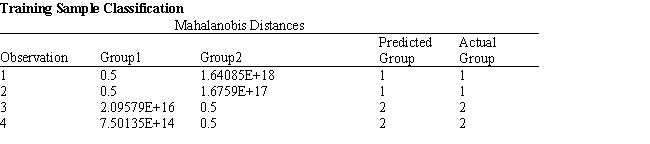
 -Refer to Exhibit 10.4. Compute the discriminant score and predicted group for someone with Score 1 of 242 and Score 2 of 142.
(Essay)
4.8/5 (27)
In the k nearest neighbor technique, a small value of k produces classifications that are
(Multiple Choice)
4.9/5 (27)
A test sample is often used to perform ___________ of how well the model will work with new data
(Multiple Choice)
4.7/5 (33)
Classification refers to a type of data mining problem that uses the information available in a set of independent variables to predict the value of a discrete, or categorical, dependent variable.
(True/False)
4.8/5 (33)
Filters
- Essay(0)
- Multiple Choice(0)
- Short Answer(0)
- True False(0)
- Matching(0)