Exam 10: Data Mining
Exam 1: Introduction to Modeling and Decision Analysis78 Questions
Exam 2: Introduction to Optimization and Linear Programming76 Questions
Exam 3: Modeling and Solving Lp Problems in a Spreadsheet93 Questions
Exam 4: Sensitivity Analysis and the Simplex Method76 Questions
Exam 5: Network Modeling92 Questions
Exam 6: Integer Linear Programming102 Questions
Exam 7: Goal Programming and Multiple Objective Optimization81 Questions
Exam 8: Nonlinear Programming Evolutionary Optimization87 Questions
Exam 9: Regression Analysis93 Questions
Exam 10: Data Mining125 Questions
Exam 11: Time Series Forecasting125 Questions
Exam 12: Introduction to Simulation Using Analytic Solver Platform85 Questions
Exam 13: Queuing Theory97 Questions
Exam 14: Decision Analysis125 Questions
Exam 15: Project Management Online82 Questions
Select questions type
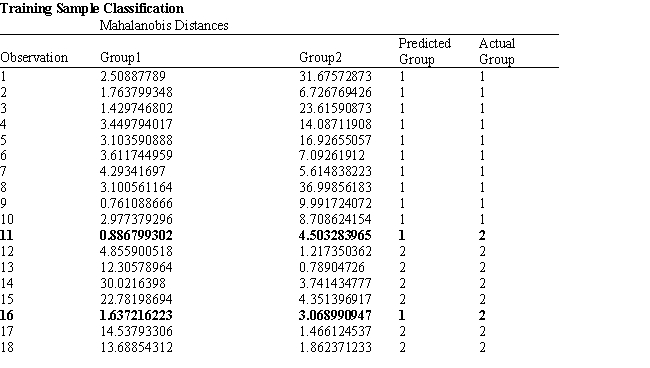
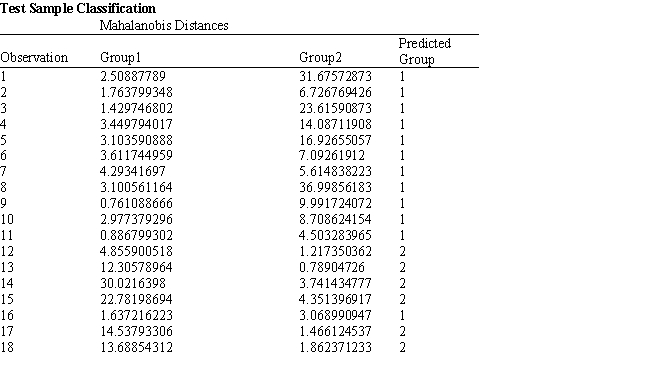
Exhibit 10.1
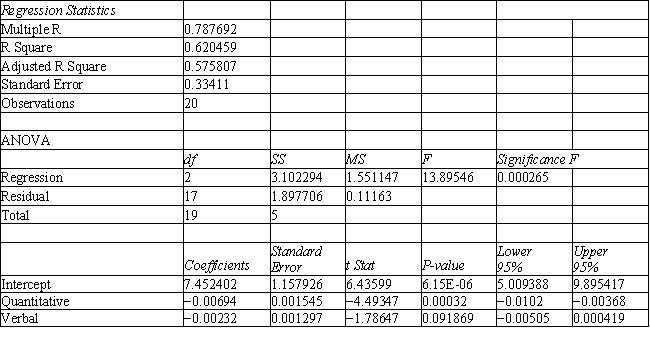
The following questions are based on the problem description and the output below.
A college admissions officer wants to evaluate graduate school applicants based on their GMAT scores, verbal and quantitative. Students are classified as either successful or not-successful in their graduate studies. The officer has data on 20 current students, ten of whom are doing very well (Group 1) and ten who are not (Group 2). 

 -Refer to Exhibit 10.1. What is the quantitative test score value of the group centroid for group 1?
(Multiple Choice)
4.9/5  (30)
(30)
Exhibit 10.1
The following questions are based on the problem description and the output below.
A college admissions officer wants to evaluate graduate school applicants based on their GMAT scores, verbal and quantitative. Students are classified as either successful or not-successful in their graduate studies. The officer has data on 20 current students, ten of whom are doing very well (Group 1) and ten who are not (Group 2). 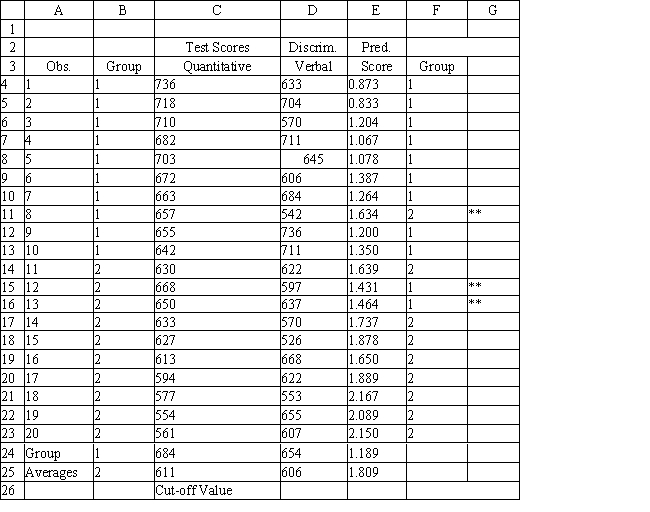


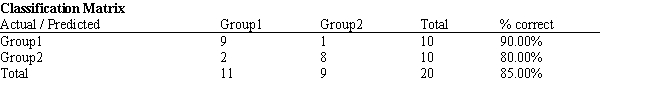
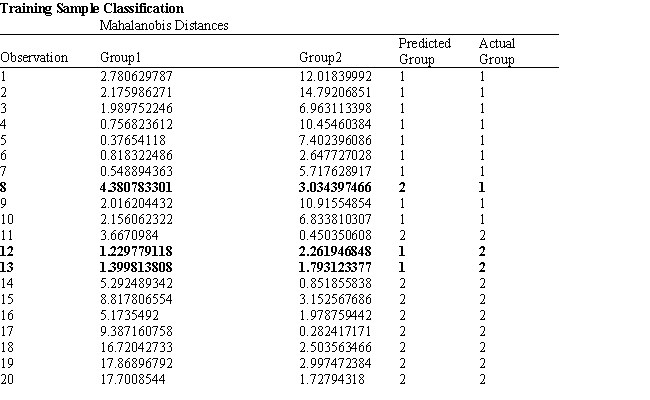
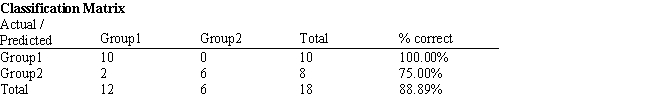
 -Refer to Exhibit 10.1. How many observations are classified correctly?
(Multiple Choice)
4.8/5 (34)
Suppose that an analyst classified a new record using the following sequential steps (i) find identical records in the training sample, (ii) determine a group, to which majority of these records belong, (iii) assign the new record to the group in step (ii). This technique is called
(Multiple Choice)
4.9/5 (35)
Exhibit 10.1
The following questions are based on the problem description and the output below.
A college admissions officer wants to evaluate graduate school applicants based on their GMAT scores, verbal and quantitative. Students are classified as either successful or not-successful in their graduate studies. The officer has data on 20 current students, ten of whom are doing very well (Group 1) and ten who are not (Group 2).
-Refer to Exhibit 10.1. What formula is entered in cell E4 and copied to cells E5:E25 of the spreadsheet?
(Multiple Choice)
4.8/5 (37)
Exhibit 10.5
The information below is used for the following questions.
A counselor wants to classify people as belonging to one of three groups based on two scores. The counselor has collected data on twenty people who are known to be in one of the three groups. The data for the problem are in the following spreadsheet. Relevant output is also included. 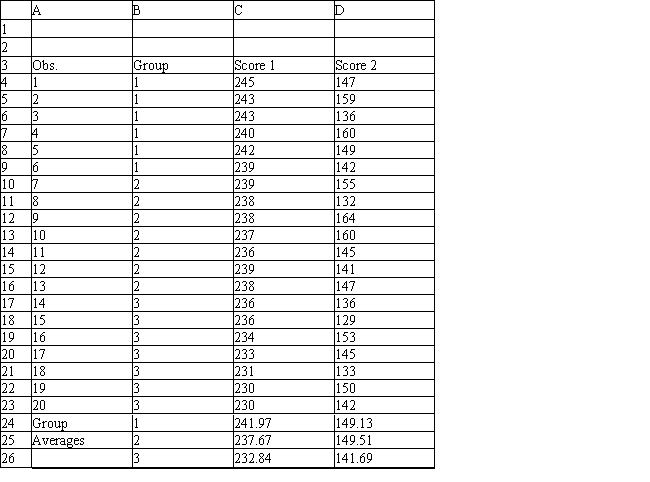
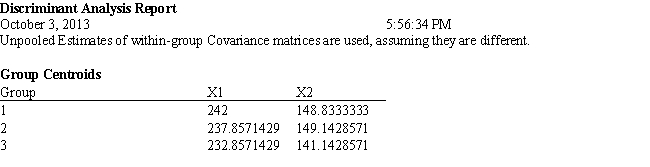
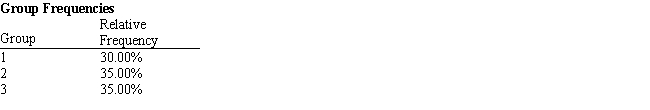
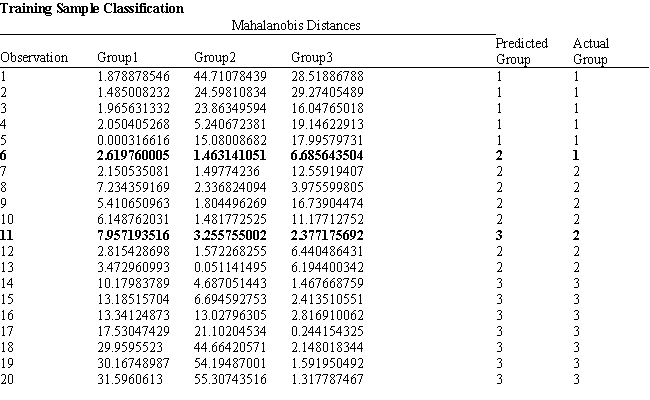
-Refer to Exhibit 10.5. Based on the 20 observations in the model complete the following confusion/classification matrix.
-Refer to Exhibit 10.5. Based on the 20 observations in the model complete the following confusion/classification matrix. 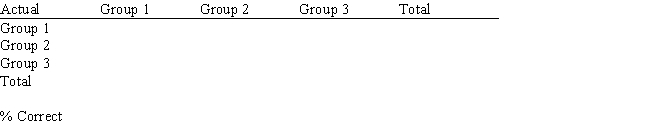
(Essay)
4.8/5 (31)
In a two-group discriminant analysis problem using regression, why is the midpoint cut-off value used to determine group classification?
(Multiple Choice)
4.9/5 (38)
Data mining is the process of finding and extracting useful information and insights from large data sets.
(True/False)
4.9/5 (31)
Exhibit 10.7
The information below is used for the following questions.
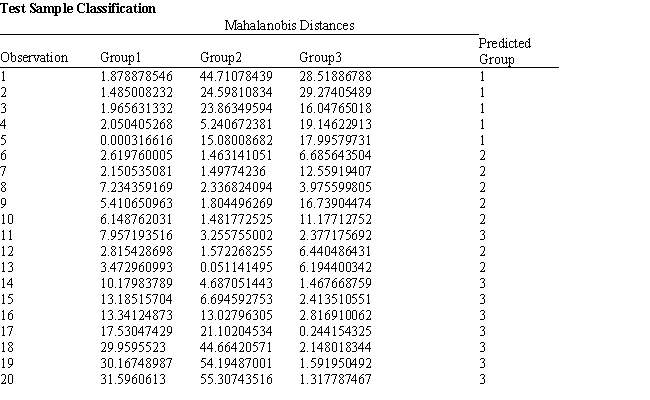
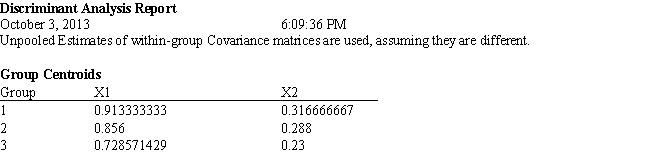
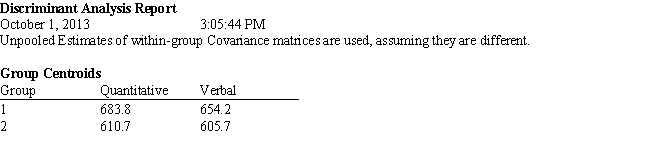
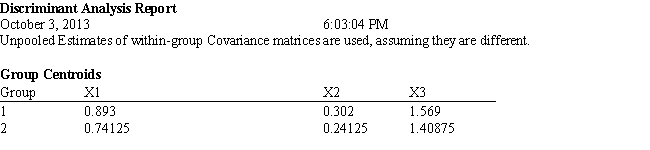
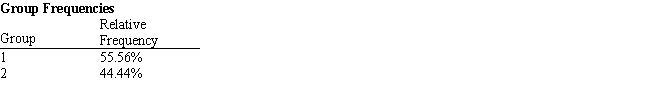
An investor wants to classify companies as being a High Risk Investment, Group 1, a Medium Risk Investment, Group 2, or a Low Risk Investment, Group 3. He has gathered Liquidity, Profitability data on 18 companies he has invested in and produced the following spreadsheet. The following Discriminant Analysis output using Analytic Solver Platform has also been generated. 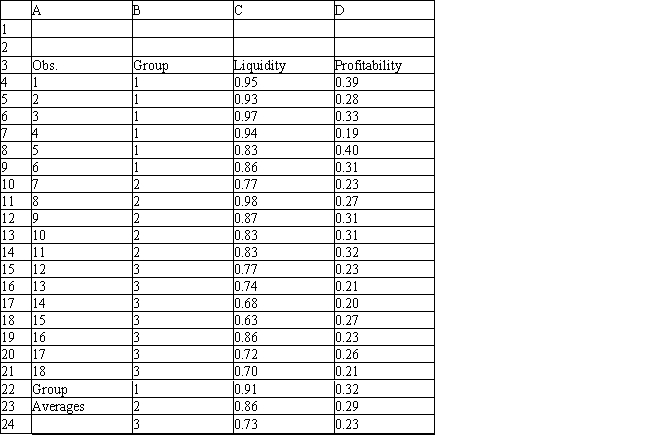
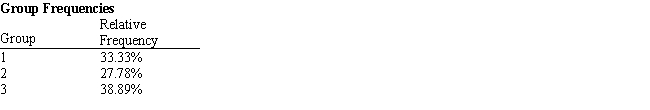
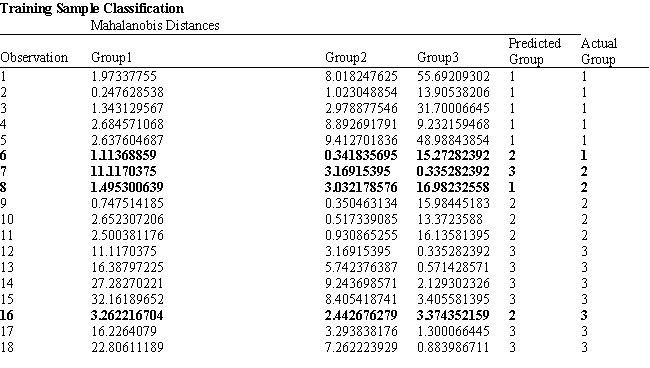
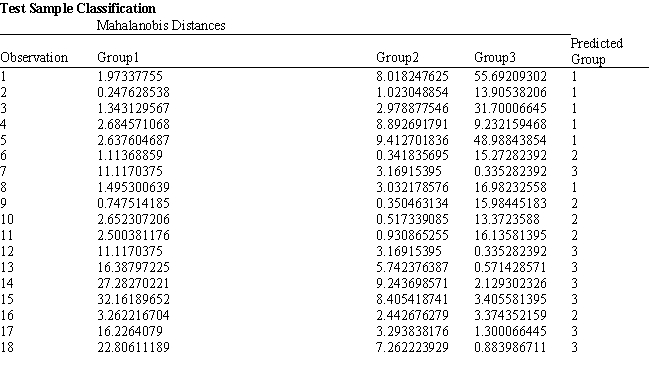 -Refer to Exhibit 10.7. Based on the 18 observations in the model complete the following confusion/classification matrix.
(Essay)
4.9/5 (28)
Exhibit 10.1
The following questions are based on the problem description and the output below.
A college admissions officer wants to evaluate graduate school applicants based on their GMAT scores, verbal and quantitative. Students are classified as either successful or not-successful in their graduate studies. The officer has data on 20 current students, ten of whom are doing very well (Group 1) and ten who are not (Group 2). 


 -Refer to Exhibit 10.1. Based on the regression output, what is the discriminant score for a student with a quantitative score of 635 and a verbal score of 570?
(Multiple Choice)
4.9/5 (30)
Exhibit 10.6
The information below is used for the following questions.
An investor wants to classify companies as being either a good investment, Group 1, or a poor investment, Group 2. He has gathered Liquidity, Profitability and Activity data on 18 companies he has invested in and run a regression analysis. Discriminant Analysis output has also been generated. The data for the problem and the relevant output are shown below. 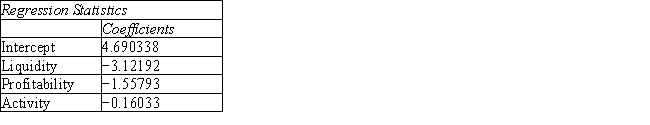
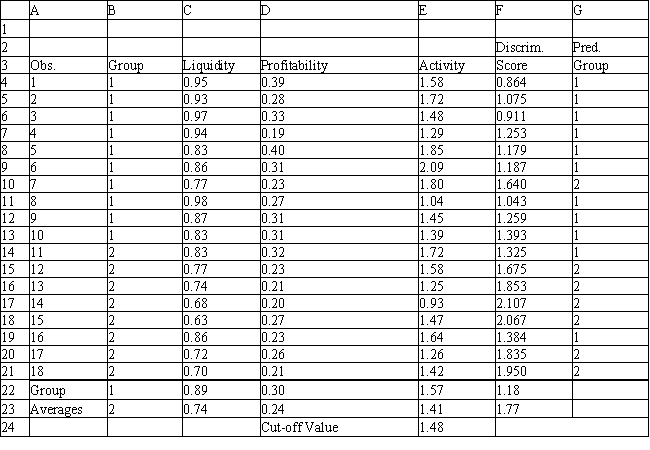
 -Refer to Exhibit 10.6. Compute the discriminant score and predicted group for a company with Liquidity = 0.80, Profitability = 0.27 and Activity = 1.55.
(Essay)
4.8/5 (28)
In using neural networks, an analyst must decide __________ and ___________
(Multiple Choice)
4.9/5 (40)
Exhibit 10.1
The following questions are based on the problem description and the output below.
A college admissions officer wants to evaluate graduate school applicants based on their GMAT scores, verbal and quantitative. Students are classified as either successful or not-successful in their graduate studies. The officer has data on 20 current students, ten of whom are doing very well (Group 1) and ten who are not (Group 2). 


 -Refer to Exhibit 10.1. What percentage of the observations is classified incorrectly?
(Multiple Choice)
4.8/5 (33)
Suppose that the observations are partitioned into m groups in equal proportion. The entropy measure for this situation is equal to
(Multiple Choice)
4.9/5 (38)
Filters
- Essay(0)
- Multiple Choice(0)
- Short Answer(0)
- True False(0)
- Matching(0)