Exam 10: Comparing Two Means
Exam 1: Why Is My Evil Lecturer Forcing Me to Learn Statistics9 Questions
Exam 2: The Spine of Statistics25 Questions
Exam 3: The Phoenix of Statistics16 Questions
Exam 4: The Ibm Spss Statistics Environment25 Questions
Exam 5: Exploring Data With Graphs12 Questions
Exam 6: The Beast of Bias23 Questions
Exam 7: Non-Parametric Models20 Questions
Exam 8: Correlation23 Questions
Exam 9: The Linear Model Regression20 Questions
Exam 10: Comparing Two Means25 Questions
Exam 11: Moderation, Mediation and Multicategory Predictors16 Questions
Exam 12: Glm 1: Comparing Several Independent Means22 Questions
Exam 13: Glm 2: Comparing Means Adjusted for Other Predictors Analysis of Covariance25 Questions
Exam 14: Glm 3: Factorial Designs25 Questions
Exam 15: Glm 4: Repeated-Measures Designs24 Questions
Exam 16: Glm 5: Mixed Designs17 Questions
Exam 17: Multivariate Analysis of Variance Manova19 Questions
Exam 18: Exploratory Factor Analysis22 Questions
Exam 19: Categorical Outcomes: Chi-Square and Loglinear Analysis24 Questions
Exam 20: Categorical Outcomes: Logistic Regression24 Questions
Exam 21: Multilevel Linear Models9 Questions
Select questions type
A researcher was interested in stress levels of lecturers during lectures. She took the same group of eight lecturers and measured their anxiety (out of 15) during a normal lecture and again in a lecture in which she had paid students to be disruptive and misbehave. Based on the SPSS output, how would you interpret these results? 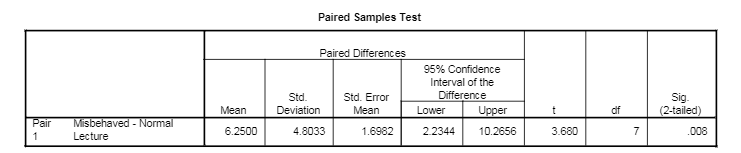
(Multiple Choice)
4.8/5  (29)
(29)
In a t-test to determine whether analgesia or a placebo provide pain relief, the t-value obtained for the two-tailed probability p is found to be a low number at p = .042. What can be deduced about this result?
(Multiple Choice)
4.8/5 (32)
Participants take a simulated driving test twice. In one condition they have no alcohol, in the other they have enough alcohol to take them over the legal limit. What type of design is this?
(Multiple Choice)
4.8/5 (38)
Filters
- Essay(0)
- Multiple Choice(0)
- Short Answer(0)
- True False(0)
- Matching(0)