Exam 13: Policy Effects and Costs Shocks in the Asad Model
Exam 1: The Scope and Method of Economics65 Questions
Exam 2: The Economic Problem: Scarcity and Choice107 Questions
Exam 3: Demand, Supply, and Market Equilibrium86 Questions
Exam 4: Demand and Supply Applications37 Questions
Exam 5: Introduction to Macroeconomics64 Questions
Exam 6: Measuring National Output and National Income84 Questions
Exam 7: Unemployment, Inflation, and Long-Run Growth81 Questions
Exam 8: Aggregate Expenditure and Equilibrium Output58 Questions
Exam 9: The Government and Fiscal Policy71 Questions
Exam 10: The Money Supply and the Federal Reserve System96 Questions
Exam 11: Money Demand and the Equilibrium Interest Rate96 Questions
Exam 12: The Determination of Aggregate Output, the Price Level, and the Interest Rate100 Questions
Exam 13: Policy Effects and Costs Shocks in the Asad Model89 Questions
Exam 14: The Labor Market in the Macroeconomy111 Questions
Exam 15: Financial Crises, Stabilization, and Deficits102 Questions
Exam 16: Household and Firm Behavior in the Macroeconomy: a Further Look92 Questions
Exam 17: Long-Run Growth59 Questions
Exam 18: Alternative Views in Macroeconomics88 Questions
Exam 19: International Trade, Comparative Advantage, and Protectionism63 Questions
Exam 20: Open-Economy Macroeconomics: the Balance of Payments and Exchange Rates105 Questions
Exam 21: Economic Growth in Developing and Transitional Economies48 Questions
Select questions type
Monetary and Fiscal Policy Effects
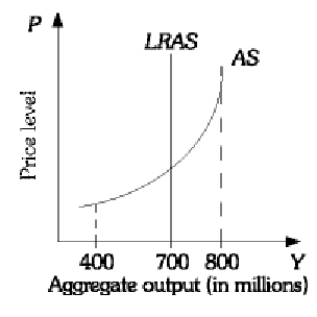 -Using the above graph, which output level is is considered potential output? Explain.
(Essay)
4.8/5  (39)
(39)
Could a high degree of monopoly power in an economy provide the explanation for inflation?
(Essay)
4.8/5 (37)
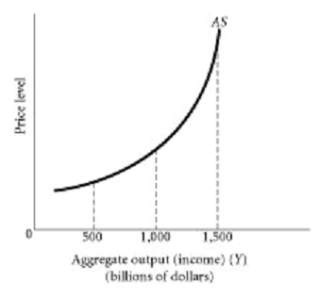 -Using the graph above, where does the economy reach capacity and how do you know?
(Essay)
4.8/5 (38)
Define cost-push inflation. Using an AS/AD diagram, illustrate how cost-push inflation affects the level of aggregate output and the price level in the economy. Suppose that the government uses expansionary fiscal policy to counter the effects of the cost-push inflation. Indicate on the diagram the impact of this policy on the price level and level of aggregate output.
(Essay)
4.8/5 (41)
List some of the elements that have increased the aggregate supply curve during the 1960s and 1970s that relate to labor.
(Essay)
4.9/5 (43)
Assume that in the long run input prices fully adjust to changes in output prices. Use a diagram to indicate the effect of an expansionary fiscal policy on the price level and equilibrium level of output in the long run.
(Essay)
4.9/5 (43)
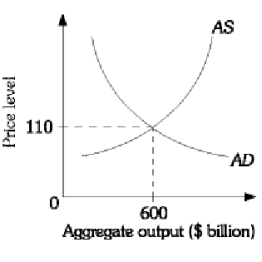 -Using the above graph assume that the economy is in equilibrium at an output level of $600 billion and a price level of 110. What would happen to the aggregate output level and the price level in th face of an oil embargo?
(Essay)
4.8/5 (39)
Filters
- Essay(0)
- Multiple Choice(0)
- Short Answer(0)
- True False(0)
- Matching(0)