Exam 12: One-Way Analysis of Variance
Exam 1: Looking at Datadistributions127 Questions
Exam 2: Looking at Datarelationships48 Questions
Exam 3: Producing Data70 Questions
Exam 4: Probability: the Study of Randomness93 Questions
Exam 5: Sampling Distributions77 Questions
Exam 6: Introduction to Inference89 Questions
Exam 7: Inference for Means103 Questions
Exam 8: Inference for Proportions101 Questions
Exam 9: Inference for Categorical Data122 Questions
Exam 10: Inference for Regression91 Questions
Exam 11: Multiple Regression95 Questions
Exam 12: One-Way Analysis of Variance74 Questions
Exam 13: Two-Way Analysis of Variance53 Questions
Exam 14: Logistic Regression53 Questions
Exam 15: Nonparametric Tests57 Questions
Exam 16: Bootstrap Methods and Permutation Tests42 Questions
Exam 17: Statistics for Quality: Control and Capability86 Questions
Select questions type
At what age do babies learn to crawl? Does it take longer to learn in the winter when babies are often bundled in clothes that restrict their movement? Data were collected from parents who brought their babies into the University of Denver Infant Study Center to participate in one of a number of experiments between 1988 and 1991.Parents reported the birth month and the age at which their child was first able to creep or crawl a distance of 4 feet within 1 minute.The resulting data were grouped by month of birth: January,May,and September:  Crawling age is given in weeks.Assume the data represent three independent simple random samples,one from each of the three populations consisting of babies born in that particular month,and that the populations of crawling ages have Normal distributions. A partial ANOVA table is given below.
  Multiple comparison procedures are going to be used to calculate simultaneous confidence intervals for all pairwise comparisons using the Bonferroni method.
For = 0.10,the value of t** is 2.16.What would be the 90% confidence interval for the difference between May and September using the Bonferroni method?
Multiple comparison procedures are going to be used to calculate simultaneous confidence intervals for all pairwise comparisons using the Bonferroni method.
For = 0.10,the value of t** is 2.16.What would be the 90% confidence interval for the difference between May and September using the Bonferroni method?
(Multiple Choice)
4.8/5  (37)
(37)
At what age do babies learn to crawl? Does it take longer to learn in the winter when babies are often bundled in clothes that restrict their movement? Data were collected from parents who brought their babies into the University of Denver Infant Study Center to participate in one of a number of experiments between 1988 and 1991.Parents reported the birth month and the age at which their child was first able to creep or crawl a distance of 4 feet within 1 minute.The resulting data were grouped by month of birth: January,May,and September: 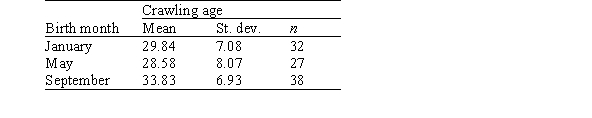 Crawling age is given in weeks.Assume the data represent three independent simple random samples,one from each of the three populations consisting of babies born in that particular month,and that the populations of crawling ages have Normal distributions. A partial ANOVA table is given below.
 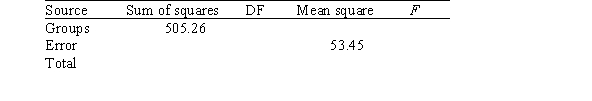 What can we say about the P-value for this F test?
(Multiple Choice)
4.8/5 (37)
Which of the following statements about the one-way analysis of variance model and/or procedures is/are FALSE?
(Multiple Choice)
5.0/5 (36)
A study on color brightness for different types of projectors involved three different brands: A,B,and C.The projectors were rated for color brightness (a higher score means brighter colors).Random samples of 15 of the ratings from each brand were taken.The SPSS output from the analysis is (partially)given below. 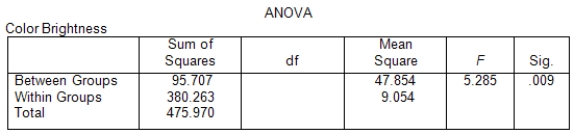 What are the degrees of freedom for the F statistic?
(Multiple Choice)
4.9/5 (40)
A service center for electronic equipment is conducting a study on three of their technicians: Joe,John,and James.All three specialize in repairing computer drives.The study was performed to study the service time of fixing the computer drives.The manager of the service center wishes to assess if the average service times for the three technicians are equal: H0: 1 = 2 = 3.Each technician was given a random sample of computer drives,and the service time for each was recorded.The ANOVA table and descriptive statistics are given below. 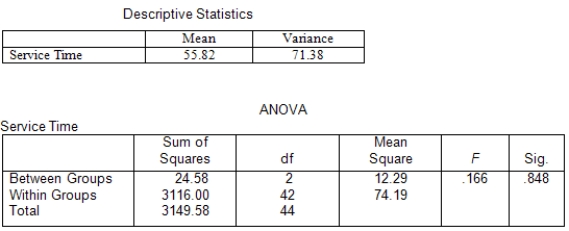 At the 5% significance level,would we reject the null hypothesis?
(Multiple Choice)
4.8/5 (38)
Which of the following statements about the analysis of variance (ANOVA)is/are FALSE?
(Multiple Choice)
4.9/5 (42)
A realtor wishes to assess whether a difference exists between home prices in three subdivisions.Independent samples of homes from each of the three subdivisions are obtained and their prices are recorded.The analysis of variance results for comparing these prices are provided below.  What can we say about the P-value for this F test?
(Multiple Choice)
5.0/5 (38)
Quality ratings of a new line of take-home refrigerated entrées were obtained from three randomly formed groups of customers who were exposed to different types of advertisements about the product.One group,with 55 customers,saw ads that were designed to undermine their expected positive association of quality with advertisements;a second group of 36 customers saw ads that were designed to affirm their positive association of quality with advertisements;the third group with 36 subjects served as the control group.The following is the ANOVA table obtained from the data in the study.(Some entries have been replaced by **.) 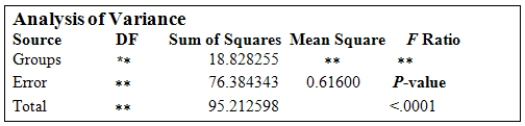 What is the value of the F statistic for testing that the three group means are equal?
(Multiple Choice)
4.8/5 (40)
At a large automobile factory,four different machines are used to produce disc brakes.To make sure that the disc brakes are all being produced with comparable diameters,daily samples of 16 disc brakes are taken from the production lines of each of the four machines and their diameters measured.The deviation from the goal diameter of 322 micrometers is measured to the nearest micrometer.Assume that the distribution of these deviations is approximately Normal with a common standard deviation.Does it appear that disc brakes made on the four machines are made with equal mean diameters? SPSS output is included below.  At the 5% significance level,do we reject the null hypothesis of equality of the four population means?
(Multiple Choice)
4.8/5 (38)
Quality ratings of a new line of take-home refrigerated entrées were obtained from three randomly formed groups of customers who were exposed to different types of advertisements about the product.One group,with 55 customers,saw ads that were designed to undermine their expected positive association of quality with advertisements;a second group of 36 customers saw ads that were designed to affirm their positive association of quality with advertisements;the third group with 36 subjects served as the control group.The following is the ANOVA table obtained from the data in the study.(Some entries have been replaced by **.)  The degrees of freedom for total,groups,and error are,respectively,
(Multiple Choice)
4.9/5 (47)
Wild horse populations on federal lands have been protected since 1971.Since that time,the populations have grown large and need to be managed and kept to a supportable size.Management of the mustang population has been a controversial issue;one common method is periodic removal of the horses.Researchers were curious if a new method would work better.In 1985,12 horses were rounded up and male horses in the group of 12 were treated.The number of foals in each group of 12 horses for 3 years was recorded.Year 1 was prior to treatment,year 2 was the year the treatment was applied,and year 3 was 1 year after treatment.The average number of foals per group along with the standard deviation is given in the table below. 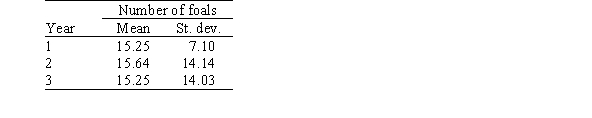 The researchers did an ANOVA F test of the data and obtained the following results.
 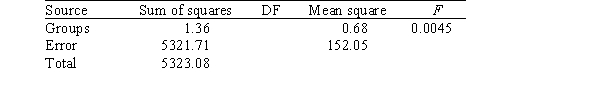 For this example,which of the following conclusions is most reasonable?
(Multiple Choice)
5.0/5 (47)
A study was conducted to compare five different training programs for improving endurance.Forty subjects were randomly divided into five groups of eight subjects in each group.A different training program was assigned to each group.After 2 months,the improvement in endurance was recorded for each subject.A one-way ANOVA is used to compare the five training programs,and the resulting F statistic is 3.69. Which distribution was used to find the P-value?
(Multiple Choice)
4.8/5 (37)
In a study comparing four groups with six observations in each group,the MSE = 487 and the MSG = 3456.What is the value of the coefficient of determination?
(Multiple Choice)
4.8/5 (37)
At a large automobile factory,four different machines are used to produce disc brakes.To make sure that the disc brakes are all being produced with comparable diameters,daily samples of 16 disc brakes are taken from the production lines of each of the four machines and their diameters measured.The deviation from the goal diameter of 322 micrometers is measured to the nearest micrometer.Assume that the distribution of these deviations is approximately Normal with a common standard deviation.Does it appear that disc brakes made on the four machines are made with equal mean diameters? SPSS output is included below.  Some summary measures for the four machines are given below.
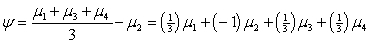
 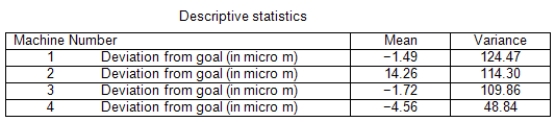 Suppose we are interested in the contrast that compares the average of machines 1,3,and 4 (the most recently purchased machines)to machine 2 (a slightly older model).
 SPSS output for multiple comparisons is given below,using the Bonferroni method with = 0.05.
 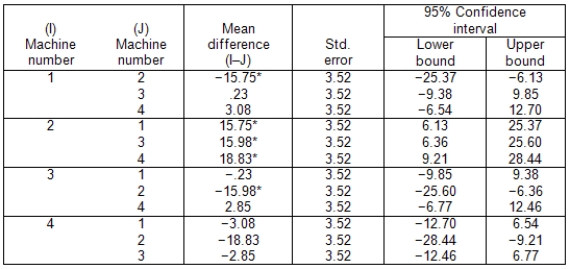 What is the correct conclusion based on these comparisons?
(Multiple Choice)
4.9/5 (37)
A service center for electronic equipment is conducting a study on three of their technicians: Joe,John,and James.All three specialize in repairing computer drives.The study was performed to study the service time of fixing the computer drives.The manager of the service center wishes to assess if the average service times for the three technicians are equal: H0: 1 = 2 = 3.Each technician was given a random sample of computer drives,and the service time for each was recorded.The ANOVA table and descriptive statistics are given below.  Under the null hypothesis of equality of population means,what is the point estimate of the common mean?
(Multiple Choice)
4.8/5 (34)
Battery life of tablet computers is of great concern to customers.A consumer group has tested four brands of such tablets to determine the battery life.Samples of tablets of each brand were fully charged and left to run until the battery died.The number of hours that each tablet lasted was recorded.The following graphs and tables from the analysis of the data are provided.(Note: Some entries have been omitted and replaced with **.) 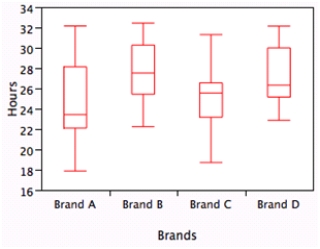
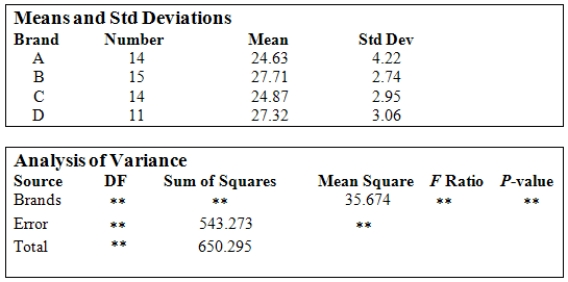 If one wanted to calculate the SST from the data,the value of the overall mean
  needs to be determined.Using the above information,what is the value of the overall mean?
(Multiple Choice)
5.0/5 (37)
A realtor wishes to assess whether a difference exists between home prices in three subdivisions.Independent samples of homes from each of the three subdivisions are obtained and their prices are recorded.The analysis of variance results for comparing these prices are provided below. 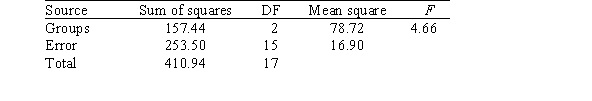 Under the null hypothesis of equality of population means,what is the appropriate distribution for the test statistic?
(Multiple Choice)
4.8/5 (35)
In a study on scholastic test scores of entering college freshmen,a random sample of colleges across the nation is selected and the average SAT Math score for the freshman class is recorded.The colleges are categorized according to their affiliation: public,private,or church.Does it appear that freshmen entering the three different types of schools do equally well on the SAT Math? Computer output is included below. 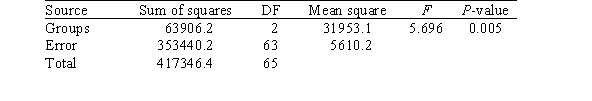 At a significance level of 0.05,what is the appropriate conclusion about the average SAT Math scores?
(Multiple Choice)
4.8/5 (39)
A study compares six groups with five observations in each group.An F statistic of 4.012 is reported.What can we say about the P-value for this F test?
(Multiple Choice)
4.8/5 (38)
At a large automobile factory,four different machines are used to produce disc brakes.To make sure that the disc brakes are all being produced with comparable diameters,daily samples of 16 disc brakes are taken from the production lines of each of the four machines and their diameters measured.The deviation from the goal diameter of 322 micrometers is measured to the nearest micrometer.Assume that the distribution of these deviations is approximately Normal with a common standard deviation.Does it appear that disc brakes made on the four machines are made with equal mean diameters? SPSS output is included below. 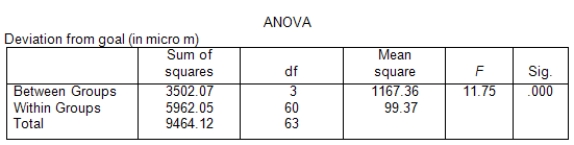 What are the degrees of freedom for the F statistic?
(Multiple Choice)
4.9/5 (46)
Filters
- Essay(0)
- Multiple Choice(0)
- Short Answer(0)
- True False(0)
- Matching(0)