Exam 12: One-Way Analysis of Variance
Exam 1: Looking at Datadistributions127 Questions
Exam 2: Looking at Datarelationships48 Questions
Exam 3: Producing Data70 Questions
Exam 4: Probability: the Study of Randomness93 Questions
Exam 5: Sampling Distributions77 Questions
Exam 6: Introduction to Inference89 Questions
Exam 7: Inference for Means103 Questions
Exam 8: Inference for Proportions101 Questions
Exam 9: Inference for Categorical Data122 Questions
Exam 10: Inference for Regression91 Questions
Exam 11: Multiple Regression95 Questions
Exam 12: One-Way Analysis of Variance74 Questions
Exam 13: Two-Way Analysis of Variance53 Questions
Exam 14: Logistic Regression53 Questions
Exam 15: Nonparametric Tests57 Questions
Exam 16: Bootstrap Methods and Permutation Tests42 Questions
Exam 17: Statistics for Quality: Control and Capability86 Questions
Select questions type
Wild horse populations on federal lands have been protected since 1971.Since that time,the populations have grown large and need to be managed and kept to a supportable size.Management of the mustang population has been a controversial issue;one common method is periodic removal of the horses.Researchers were curious if a new method would work better.In 1985,12 horses were rounded up and male horses in the group of 12 were treated.The number of foals in each group of 12 horses for 3 years was recorded.Year 1 was prior to treatment,year 2 was the year the treatment was applied,and year 3 was 1 year after treatment.The average number of foals per group along with the standard deviation is given in the table below. 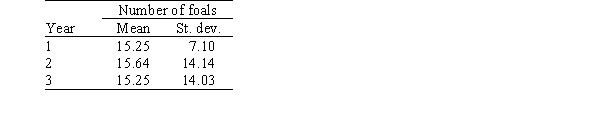 The researchers did an ANOVA F test of the data and obtained the following results.
 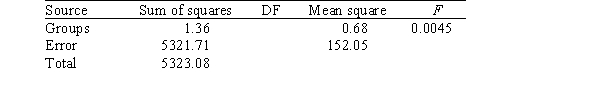 What can we say about the P-value for this F test?
(Multiple Choice)
4.8/5  (36)
(36)
Battery life of tablet computers is of great concern to customers.A consumer group has tested four brands of such tablets to determine the battery life.Samples of tablets of each brand were fully charged and left to run until the battery died.The number of hours that each tablet lasted was recorded.The following graphs and tables from the analysis of the data are provided.(Note: Some entries have been omitted and replaced with **.) 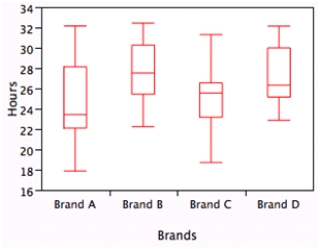
 What is the value of the coefficient of determination,
  ?
?
(Multiple Choice)
4.9/5 (38)
Independent random samples of households in the four U.S.regions (Northeast,Midwest,South,and West)yielded data on last year's energy consumption.We are interested in assessing,at the 1% significance level,if the data provide sufficient evidence to conclude that last year's average energy consumption was different among the four U.S.regions.Assume that energy consumption in the four regions is Normally distributed.
SPSS was used to create the side-by-side boxplots shown below. 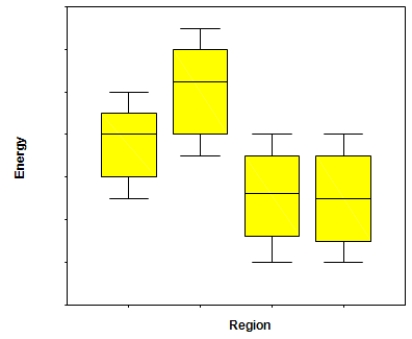 What assumption needed for an ANOVA F test can be checked with this graph?
(Short Answer)
4.8/5 (26)
It is widely believed that a person's level of fitness prior to undergoing corrective knee surgery is an important factor in the speed of rehabilitation following surgery.A study was undertaken with 24 randomly selected male subjects who were to undergo such surgery.The physical fitness status of each subject before the surgery was categorized as being below average (n = 8),average (n = 10),or above average (n = 6).Following surgery,the number of days spent in physical therapy by each patient until fully rehabilitated was determined.Examination of side-by-side boxplots indicated that it was reasonable to assume that the samples came from populations with equal standard deviations. The following ANOVA table was obtained.(Some entries have been replaced with **.) 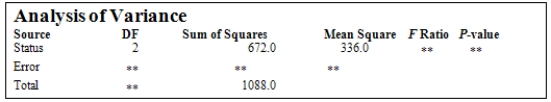 The degrees of freedom associated with the ANOVA F test are ____________.
(Multiple Choice)
4.8/5 (39)
A storeowner wishes to compare the average amount of money high school and college students spend on music downloads.He randomly selects 10 students from three different student populations: high school,undergraduate,and graduate.The statistical assumptions required to perform a one-way ANOVA to compare the means of these three groups are reasonable based on the data.A partially completed ANOVA table is provided below.  At the 1% significance level,would we reject the null hypothesis?
(Multiple Choice)
4.9/5 (34)
Independent random samples of households in the four U.S.regions (Northeast,Midwest,South,and West)yielded data on last year's energy consumption.We are interested in assessing,at the 1% significance level,if the data provide sufficient evidence to conclude that last year's average energy consumption was different among the four U.S.regions.Assume that energy consumption in the four regions is Normally distributed.
SPSS was used to create the side-by-side boxplots shown below.  Based on the boxplots,does it seem like the assumption is satisfied? Explain briefly.
(Short Answer)
4.8/5 (37)
At a large automobile factory,four different machines are used to produce disc brakes.To make sure that the disc brakes are all being produced with comparable diameters,daily samples of 16 disc brakes are taken from the production lines of each of the four machines and their diameters measured.The deviation from the goal diameter of 322 micrometers is measured to the nearest micrometer.Assume that the distribution of these deviations is approximately Normal with a common standard deviation.Does it appear that disc brakes made on the four machines are made with equal mean diameters? SPSS output is included below.  Some summary measures for the four machines are given below.
  Suppose we are interested in the contrast that compares the average of machines 1,3,and 4 (the most recently purchased machines)to machine 2 (a slightly older model).
 What is the value of the standard error of the contrast ?
(Multiple Choice)
4.9/5 (36)
In a study on scholastic test scores of entering college freshmen,a random sample of colleges across the nation is selected and the average SAT Math score for the freshman class is recorded.The colleges are categorized according to their affiliation: public,private,or church.Does it appear that freshmen entering the three different types of schools do equally well on the SAT Math? Computer output is included below. 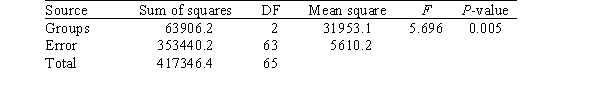 How many colleges were included in the study?
(Multiple Choice)
4.8/5 (39)
Bleaching chemicals are used in the pulp and paper industry to increase the brightness of the paper that is produced.Four chemical agents were studied to determine their effect on the brightness of paper produced from pulp treated with the chemical.The following tables provide some details obtained from the experimental data.  The null hypothesis Ho:
  was established for the ANOVA.
What is the appropriate alternative hypothesis?
was established for the ANOVA.
What is the appropriate alternative hypothesis?
(Multiple Choice)
4.9/5 (39)
A study compares three population means.Three independent samples with 15 observations each are taken.The SSE = 1246 and the SST = 1600.What is the value of the F statistic?
(Multiple Choice)
4.9/5 (42)
Which of the following statements about the sums of squares associated with the analysis of variance is/are FALSE?
(Multiple Choice)
4.8/5 (38)
At a large automobile factory,four different machines are used to produce disc brakes.To make sure that the disc brakes are all being produced with comparable diameters,daily samples of 16 disc brakes are taken from the production lines of each of the four machines and their diameters measured.The deviation from the goal diameter of 322 micrometers is measured to the nearest micrometer.Assume that the distribution of these deviations is approximately Normal with a common standard deviation.Does it appear that disc brakes made on the four machines are made with equal mean diameters? SPSS output is included below. 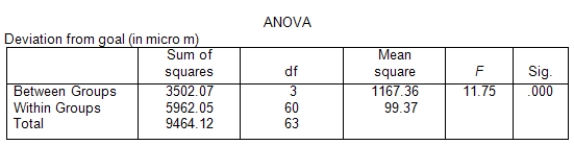 Some summary measures for the four machines are given below.
  Suppose we are interested in the contrast that compares the average of machines 1,3,and 4 (the most recently purchased machines)to machine 2 (a slightly older model).
 What is the value of the estimate of the contrast ?
(Multiple Choice)
4.8/5 (39)
Battery life of tablet computers is of great concern to customers.A consumer group has tested four brands of such tablets to determine the battery life.Samples of tablets of each brand were fully charged and left to run until the battery died.The number of hours that each tablet lasted was recorded.The following graphs and tables from the analysis of the data are provided.(Note: Some entries have been omitted and replaced with **.) 
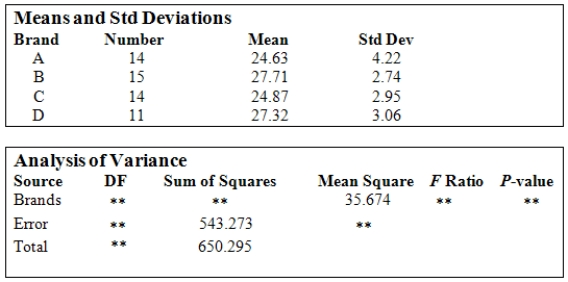 To test the ANOVA null hypothesis H0:
 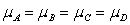 ,what are the test statistic and its associated P-value?
(Multiple Choice)
4.7/5 (45)
A storeowner wishes to compare the average amount of money high school and college students spend on music downloads.He randomly selects 10 students from three different student populations: high school,undergraduate,and graduate.The statistical assumptions required to perform a one-way ANOVA to compare the means of these three groups are reasonable based on the data.A partially completed ANOVA table is provided below. 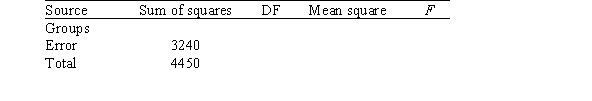 What is the value of the F statistic?
(Multiple Choice)
4.8/5 (40)
At a large automobile factory,four different machines are used to produce disc brakes.To make sure that the disc brakes are all being produced with comparable diameters,daily samples of 16 disc brakes are taken from the production lines of each of the four machines and their diameters measured.The deviation from the goal diameter of 322 micrometers is measured to the nearest micrometer.Assume that the distribution of these deviations is approximately Normal with a common standard deviation.Does it appear that disc brakes made on the four machines are made with equal mean diameters? SPSS output is included below.  Some summary measures for the four machines are given below.
 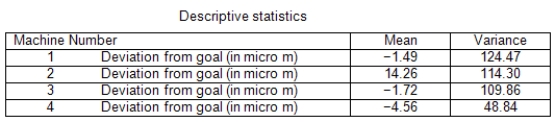 Suppose we are interested in the contrast that compares the average of machines 1,3,and 4 (the most recently purchased machines)to machine 2 (a slightly older model).
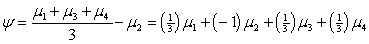 What is a 95% confidence interval for the contrast ?
(Multiple Choice)
4.8/5 (33)
A study on color brightness for different types of projectors involved three different brands: A,B,and C.The projectors were rated for color brightness (a higher score means brighter colors).Random samples of 15 of the ratings from each brand were taken.The SPSS output from the analysis is (partially)given below.  Suppose we wish to assess if the color brightness of B is significantly higher than the average of the other two brands,by conducting a hypothesis test for the appropriate contrast .Let 1,2,and 3 denote the population means for A,B,and C,respectively.What are the values of the coefficients for the contrast ?
(Multiple Choice)
4.8/5 (33)
Independent random samples of households in the four U.S.regions (Northeast,Midwest,South,and West)yielded data on last year's energy consumption.We are interested in assessing,at the 1% significance level,if the data provide sufficient evidence to conclude that last year's average energy consumption was different among the four U.S.regions.Assume that energy consumption in the four regions is Normally distributed.
SPSS was used to create the side-by-side boxplots shown below. 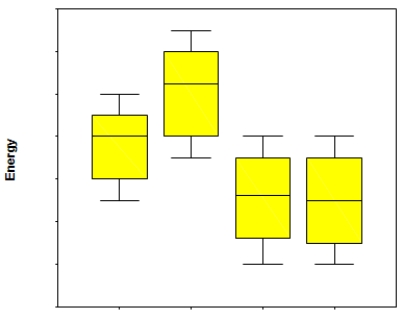 What is the null hypothesis for assessing if the mean energy consumption was the same for the four regions?
(Essay)
4.8/5 (31)
A storeowner wishes to compare the average amount of money high school and college students spend on music downloads.He randomly selects 10 students from three different student populations: high school,undergraduate,and graduate.The statistical assumptions required to perform a one-way ANOVA to compare the means of these three groups are reasonable based on the data.A partially completed ANOVA table is provided below.  What are the degrees of freedom for the F statistic?
(Multiple Choice)
4.8/5 (36)
Bleaching chemicals are used in the pulp and paper industry to increase the brightness of the paper that is produced.Four chemical agents were studied to determine their effect on the brightness of paper produced from pulp treated with the chemical.The following tables provide some details obtained from the experimental data. 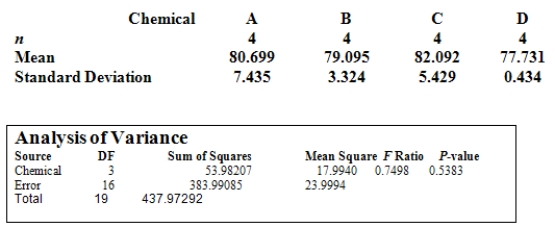 The null hypothesis Ho:
  was established for the ANOVA.
If the null hypothesis is true,the ANOVA table shows that the P-value is 0.5383.What should we conclude from this?
was established for the ANOVA.
If the null hypothesis is true,the ANOVA table shows that the P-value is 0.5383.What should we conclude from this?
(Multiple Choice)
5.0/5 (41)
A study on color brightness for different types of projectors involved three different brands: A,B,and C.The projectors were rated for color brightness (a higher score means brighter colors).Random samples of 15 of the ratings from each brand were taken.The SPSS output from the analysis is (partially)given below. 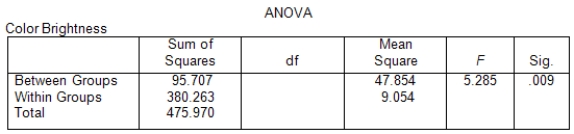 One assumption in the ANOVA is that the populations have equal standard deviations.Side-by-side boxplots of the sample data are shown below.Does this assumption seem reasonable?
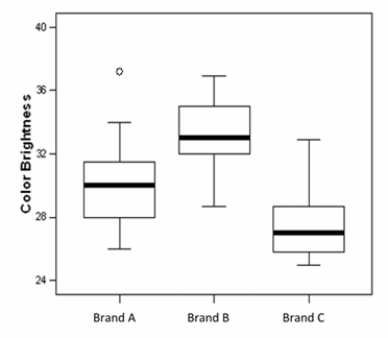
(Multiple Choice)
4.8/5 (42)
Filters
- Essay(0)
- Multiple Choice(0)
- Short Answer(0)
- True False(0)
- Matching(0)