Exam 11: B: The Analysis of Variance
Exam 1: Describing Data With Graphs134 Questions
Exam 2: Describing Data With Numerical Measures235 Questions
Exam 3: Describing Bivariate Data57 Questions
Exam 4: A: probability and Probability Distributions107 Questions
Exam 4: B: probability and Probability Distributions157 Questions
Exam 5: Several Useful Discrete Distributions166 Questions
Exam 6: The Normal Probability Distribution235 Questions
Exam 7: Sampling Distributions231 Questions
Exam 8: Large-Sample Estimation187 Questions
Exam 9: A: large-Sample Tests of Hypotheses154 Questions
Exam 9: B: large-Sample Tests of Hypotheses106 Questions
Exam 10: A: Inference From Small Samples192 Questions
Exam 10: B: Inference From Small Samples124 Questions
Exam 11: A: The Analysis of Variance136 Questions
Exam 11: B: The Analysis of Variance137 Questions
Exam 12: A: linear Regression and Correlation131 Questions
Exam 12: B: linear Regression and Correlation171 Questions
Exam 13: Multiple Regression Analysis232 Questions
Exam 14: Analysis of Categorical Data158 Questions
Exam 15: A:nonparametric Statistics139 Questions
Exam 15: B:nonparametric Statistics95 Questions
Select questions type
A study was conducted to compare fuel consumption of medium-size trucks for three brands of gasoline, A, B, and C. Four trucks of the same make and model were used in the experiment, and each gasoline brand was tested in each truck. Using each brand in the same truck has the effect of eliminating (blocking out) truck-to-truck variability. The data (litres per 100 km) are as follows:
Automobile  Use an appropriate method to identify the pairwise differences, if any, in the average fuel consumptions for the three brands of gasoline.
(Essay)
4.8/5  (34)
(34)
A computer laboratory manager must choose between three brands of battery packs for use in a laboratory of laptop computers. A major concern is the time, in hours, the battery packs will function before needing to be recharged. The manager obtains a random sample of eight observations for each of the three brands and records the following information: 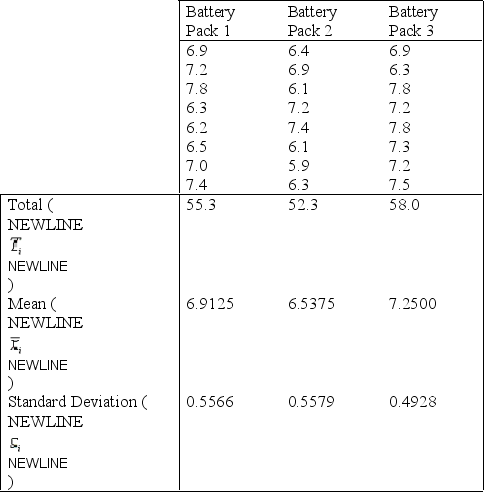
 = 1150.72, and
  = 165.6
Use Tukey's method of comparison to determine which of the three battery pack means differ from the others. Let
= 165.6
Use Tukey's method of comparison to determine which of the three battery pack means differ from the others. Let  = 0.05.
(Essay)
4.9/5 (32)
Salary of Business Graduates Narrative
An economist wants to test whether the mean starting salary (in $1000s) of business graduates is the same for three different majors and three types of class standing (top third, middle third, lowest third). No interaction is assumed. Appropriate sampling reveals the data shown below.
Starting Salaries (thousands of dollars per year)  -Provide an example for a randomized block design with three treatments (k = 3) and four blocks (b = 4), in which SSB = 0 and SST and SSE are not equal to 0.
(Essay)
4.9/5 (36)
Suppose a reading comprehension test is given to random samples of three Grade 7 students from each of five different schools. The samples are chosen so that each school provides a student categorized as low IQ, average IQ, and high IQ. Perform an analysis using the data below, treating the IQs as blocks. Is there sufficient evidence to reject the null hypothesis of no difference between the true mean test scores of the five schools? Draw conclusions using  = 0.05.
(Essay)
5.0/5 (36)
Laundry Detergent Preference Narrative
A consumer would like to know if there is a difference in the performance of three different laundry detergents. Eighteen pieces of white cloth were soiled with grape juice then washed in one of the three detergents A, B, or C. The resulting whiteness readings are listed below, where the larger number indicates whiter fabric.  -Refer to Laundry Detergent Preference Narrative. Set up the rejection region for
  = 0.05.
(Essay)
4.7/5 (38)
Product Markup Narrative
A chain of jewellery stores conducted an experiment to investigate the relationship between price and location and the demand for its diamonds. Six small-town stores were selected for the study, as well as six stores located in large suburban malls. Two stores in each of these locations were assigned to each of three item percentage markups. The percentage gain (or loss) in sales for each store was recorded at the end of one month. The data are shown in the accompanying table.
Markup  -Refer to Product Markup Narrative. Do the data provide sufficient evidence to indicate an interaction between markup and location? Justify your conclusion. (Test using
  = 0.05.)
(Essay)
4.8/5 (33)
Headache Treatments Narrative
The following data were generated from a 2 * 2 factorial experiment with three replicates, where factor A levels represent two different injection procedures of an anesthetic to the occipital nerve (located in the back of the neck), and factor B levels represent two different drugs that physicians recommend to increase the effectiveness of the injections. Three headache patients were randomly selected for each combination of injection and drug.
Factor B  -Refer to Headache Treatments Narrative. Test at the 5% significance level to determine if differences exist among the levels of factor A.
(Essay)
4.9/5 (37)
Supermarket Prices Narrative
A building contractor employs three construction engineers, A, B, and C to estimate and bid on jobs. To determine whether one tends to be a more conservative (or liberal) estimator than the others, the contractor selects four projected construction jobs and has each estimator independently estimate the cost (in dollars per square foot) of each job. The data are shown in the table:
Construction Job  -Refer to Supermarket Prices Narrative. Why is it important to treat the food items as blocks? (Hint: The observed value of the test statistic in a completely randomized design is F = 0.089, and
  = 2.69).
(Essay)
4.8/5 (34)
Supermarket Prices Narrative
A building contractor employs three construction engineers, A, B, and C to estimate and bid on jobs. To determine whether one tends to be a more conservative (or liberal) estimator than the others, the contractor selects four projected construction jobs and has each estimator independently estimate the cost (in dollars per square foot) of each job. The data are shown in the table:
Construction Job
-Refer to Supermarket Prices Narrative. If any differences in treatment means exist, use an appropriate method to identify specifically where the differences lie. Has blocking been effective in this experiment? Explain.
(Essay)
4.9/5 (40)
UBC Building Signs Narrative
A researcher at University of British Columbia (UBC) wanted to determine whether different building signs (building maps versus wall signage) affect the total amount of time visitors require to reach their destination and whether that time depends on whether the starting location is inside or outside the building. Three subjects were assigned to each of the combinations of signs and starting locations, and travel time in seconds from beginning to destination was recorded. A partial computer output of the appropriate analysis is given below:
ANOVA Table  -Refer to UBC Building Signs Narrative. What is the mean squares value for the starting location?
(Short Answer)
4.9/5 (37)
Fuel Consumption Study Narrative
A study was conducted to compare fuel consumption of medium-size trucks for three brands of gasoline, A, B, and C. Four trucks of the same make and model were used in the experiment, and each gasoline brand was tested in each truck. Using each brand in the same truck has the effect of eliminating (blocking out) truck-to-truck variability. The data (litres per 100 km) are as follow:
Automobile  -Refer to Fuel Consumption Study Narrative. Suppose that prior to looking at the data, you had decided to compare the mean fuel consumption for gasoline brands A and B. Find a 90% confidence interval for this difference.
(Essay)
4.9/5 (31)
Randomized Block Design Narrative
The partially completed ANOVA table for a randomized block design is presented below:  -Refer to Randomized Block Design Narrative. How many observations are in each treatment total?
(Essay)
4.9/5 (37)
UBC Building Signs Narrative
A researcher at University of British Columbia (UBC) wanted to determine whether different building signs (building maps versus wall signage) affect the total amount of time visitors require to reach their destination and whether that time depends on whether the starting location is inside or outside the building. Three subjects were assigned to each of the combinations of signs and starting locations, and travel time in seconds from beginning to destination was recorded. A partial computer output of the appropriate analysis is given below:
ANOVA Table
-Refer to UBC Building Signs Narrative. Find the F test statistic for testing the main effect of types of signs.
(Short Answer)
4.8/5 (40)
Healthy Dog Food Narrative
A premium dog food manufacturer claims that, since its food is so highly nutritious, you won't need to feed your dog as much as with other dog foods. The premium dog food was compared to three other brands with respect to how much a dog needed to eat, in kilograms per week, to maintain its current weight and for the dog to remain healthy. A random sample of 24 similar dogs was selected and divided into 4 groups (i.e., 6 dogs were randomly assigned to each dog food brand). The following partial analysis table was computed:
Analysis of Variance for Dog Food Brands  -Refer to Healthy Dog Food Narrative. State the null and alternative hypotheses to test whether there is a significant difference in the average amount of dog food needed to maintain a dog's current weight and for the dog to remain healthy.
(Essay)
4.9/5 (41)
Food Irradiation Narrative
In recent years the irradiation of food to reduce bacteria and preserve the food longer has become more common. A company that performs this service has developed four different methods of irradiating food. To determine which is best, it conducts an experiment where different foods are irradiated and the bacteria count is measured. As part of the experiment, the following foods are irradiated: beef, chicken, turkey, eggs, and milk. The results are shown below.
Bacteria Count  -Refer to Food Irradiation Narrative. Set up the ANOVA Table. Use
  = 0.01 to determine the critical values.
(Essay)
4.8/5 (39)
Absenteeism Narrative
The data shown below are collected using randomized design. The data values represent the number of days absent from work for three independent samples of workers.  -Refer to Absenteeism Narrative. Do the data provide sufficient evidence to indicate a difference between
  and
and  ? Justify your conclusion. Test using the two-sample independent t test with
  = 0.05.
(Essay)
4.8/5 (35)
Statistical Software Narrative
A professor of statistics is trying to determine which of three statistical software programs is best for his students. He believes that the time (in hours) it takes a student to master particular software may be influenced by gender. A 3 * 2 factorial experiment with three replicates was designed, as shown below:
Gender  -Refer to Statistical Software Narrative. Test at the 10% significance level to determine if differences exist among the types of software.
(Essay)
4.9/5 (39)
Water Samples Narrative
Water samples were taken at four different locations in a river to determine whether the quantity of dissolved oxygen, a measure of water pollution, varied from one location to another. Locations 1 and 2 were selected above an industrial plant, one near the shore and the other in midstream; location 3 was adjacent to the industrial water discharge for the plant; and location 4 was slightly downriver in midstream. Five water specimens were randomly selected at each location, but one specimen, corresponding to location 4, was lost in the laboratory. The data and an ANOVA computer printout are provided here (the greater the pollution, the lower the dissolved oxygen readings). 

 -Refer to Water Samples Narrative. Do the data provide sufficient evidence to indicate a difference in the mean dissolved oxygen contents for the four locations? Justify your conclusion.
(Essay)
4.8/5 (39)
Lifetime of Brake Shoes Narrative
An automobile parts store was interested in comparing the mean life length of three brands of automobile brake shoes. The following data represent the life length, measured in 1000s of kilometres, of random samples of six sets of brake shoes of each brand:  -Refer to Lifetime of Brake Shoes Narrative. Perform the test using the p-value approach.
(Essay)
4.8/5 (36)
Travel Agency Narrative
A travel agency primarily reserves flights with four major airlines. The agency would like to know if the true mean price for the four airlines is the same. Below are the prices for flights leaving from the same city and travelling to five different destinations.  -Refer to Travel Agency Narrative. Develop and interpret a 90% confidence interval for
  .
.
(Essay)
4.9/5 (43)
Filters
- Essay(0)
- Multiple Choice(0)
- Short Answer(0)
- True False(0)
- Matching(0)