Exam 11: B: The Analysis of Variance
Exam 1: Describing Data With Graphs134 Questions
Exam 2: Describing Data With Numerical Measures235 Questions
Exam 3: Describing Bivariate Data57 Questions
Exam 4: A: probability and Probability Distributions107 Questions
Exam 4: B: probability and Probability Distributions157 Questions
Exam 5: Several Useful Discrete Distributions166 Questions
Exam 6: The Normal Probability Distribution235 Questions
Exam 7: Sampling Distributions231 Questions
Exam 8: Large-Sample Estimation187 Questions
Exam 9: A: large-Sample Tests of Hypotheses154 Questions
Exam 9: B: large-Sample Tests of Hypotheses106 Questions
Exam 10: A: Inference From Small Samples192 Questions
Exam 10: B: Inference From Small Samples124 Questions
Exam 11: A: The Analysis of Variance136 Questions
Exam 11: B: The Analysis of Variance137 Questions
Exam 12: A: linear Regression and Correlation131 Questions
Exam 12: B: linear Regression and Correlation171 Questions
Exam 13: Multiple Regression Analysis232 Questions
Exam 14: Analysis of Categorical Data158 Questions
Exam 15: A:nonparametric Statistics139 Questions
Exam 15: B:nonparametric Statistics95 Questions
Select questions type
Laundry Detergent Preference Narrative
A consumer would like to know if there is a difference in the performance of three different laundry detergents. Eighteen pieces of white cloth were soiled with grape juice then washed in one of the three detergents A, B, or C. The resulting whiteness readings are listed below, where the larger number indicates whiter fabric.  -Refer to Laundry Detergent Preference Narrative. What is the appropriate conclusion for the test?
(Essay)
4.8/5  (41)
(41)
Breaking Strength of Thread Narrative
A textile company is interested in knowing if there is a difference in the breaking strength of four different kinds of thread. 
 = 6605.02, and
  = 362.2
-Refer to Breaking Strength of Thread Narrative. Find and interpret a 90% confidence interval for
= 362.2
-Refer to Breaking Strength of Thread Narrative. Find and interpret a 90% confidence interval for  .
.
(Essay)
4.8/5 (47)
Running Shoes Narrative
An avid runner was interested in whether there is a significant difference in the average wear (measured in weeks of use) among three brands of running shoes. To answer the question, the runner randomly selected six runners and assigned them to wear each of the three brands of running shoes until the shoes wore out. Each of the runners wore the brands of shoes in a random order.
After the data had been recorded, the following output was generated using statistical software:
Two-way Analysis of Variance  -Refer to Running Shoes Narrative. Use the p-value approach to determine whether there is a significant difference in the average wear between the three brands of running shoes. Let
  = 0.05.
(Essay)
4.8/5 (43)
In a completely randomized design, 7 experimental units were assigned to the first treatment, 13 units to the second treatment, and 10 units to the third treatment. A partial ANOVA table for this experiment is shown below:  a. Fill in the blanks (identified by asterisks) in the above ANOVA Table.
b. Test at the 5% significance level to determine if differences exist among the three treatment means.
a. Fill in the blanks (identified by asterisks) in the above ANOVA Table.
b. Test at the 5% significance level to determine if differences exist among the three treatment means.
(Essay)
4.8/5 (37)
UBC Building Signs Narrative
A researcher at University of British Columbia (UBC) wanted to determine whether different building signs (building maps versus wall signage) affect the total amount of time visitors require to reach their destination and whether that time depends on whether the starting location is inside or outside the building. Three subjects were assigned to each of the combinations of signs and starting locations, and travel time in seconds from beginning to destination was recorded. A partial computer output of the appropriate analysis is given below:
ANOVA Table  -Refer to UBC Building Signs Narrative. In order to determine the critical value of the F ratio against which to test for differences between the levels of factor B, which numerator and which denominator, respectively, for df should we use?
(Short Answer)
4.7/5 (41)
Laptop Battery Charge Time Narrative
A computer laboratory manager must choose between three brands of battery packs for use in a laboratory of laptop computers. A major concern is the time, in hours, the battery packs will function before needing to be recharged. The manager obtains a random sample of eight observations for each of the three brands and records the following information: 
 = 1150.72, and
  = 165.6
-Refer to Laptop Battery Charge Time Narrative. Calculate the test statistic.
= 165.6
-Refer to Laptop Battery Charge Time Narrative. Calculate the test statistic.
(Essay)
4.9/5 (40)
Salary of Business Graduates Narrative
An economist wants to test whether the mean starting salary (in $1000s) of business graduates is the same for three different majors and three types of class standing (top third, middle third, lowest third). No interaction is assumed. Appropriate sampling reveals the data shown below.
Starting Salaries (thousands of dollars per year)  -Refer to Salary of Business Graduates Narrative. Create the appropriate ANOVA table.
(Essay)
4.9/5 (39)
Absenteeism Narrative
The data shown below are collected using randomized design. The data values represent the number of days absent from work for three independent samples of workers.  -Refer to Absenteeism Narrative. Find a 90% confidence interval for the difference (
  ).
).
(Essay)
4.9/5 (40)
Due to his high blood pressure, Sam watches the sodium content of the foods that he eats. Five samples for each of four brands of canned turkey (97% fat free) were tested for sodium content, measured in milligrams of sodium per 60 gram serving.  The following summary table and ANOVA were generated by statistical software as shown below:
 Use the following output generated by statistical software to determine which of the means are different.
Tukey's pairwise comparisons
Family error rate = 0.0500
Individual error rate = 0.0113
Critical value = 4.05
Intervals for (column level mean) - (row level mean)
Use the following output generated by statistical software to determine which of the means are different.
Tukey's pairwise comparisons
Family error rate = 0.0500
Individual error rate = 0.0113
Critical value = 4.05
Intervals for (column level mean) - (row level mean) 
(Essay)
4.7/5 (34)
Treatment Observation Narrative
An independent random sampling design was used to compare the means of six treatments based on samples of four observations per treatment. The pooled estimator of  is 9.42, and the sample means follow:
  = 102.1,
  = 98.9,
  = 112.8,
  = 93.4,
  = 104.7, and
  = 114.3.
-Refer to Treatment Observation Narrative. Give the value of
= 114.3.
-Refer to Treatment Observation Narrative. Give the value of  that you would use to make pairwise comparisons of the treatment means for
  = 0.05.
(Essay)
4.8/5 (41)
A travel agency primarily reserves flights with four major airlines. The agency would like to know if the true mean price for the four airlines is the same. Below are the prices for flights leaving from the same city travelling to five different destinations.  Test the null hypothesis of no difference in the true mean price for the four airlines in a completely randomized design. Use = 0.05.
(Essay)
4.8/5 (34)
The following statistics were calculated based on samples drawn from three normal populations:
Treatment  Set up the ANOVA table and test at the 5% level of significance to determine whether differences exist among the population means.
(Essay)
4.8/5 (32)
Absenteeism Narrative
The data shown below are collected using randomized design. The data values represent the number of days absent from work for three independent samples of workers.
-Refer to Absenteeism Narrative. Use the p-value approach to determine whether there is a difference in the three population means.
(Essay)
4.9/5 (48)
Running Shoes Narrative
An avid runner was interested in whether there is a significant difference in the average wear (measured in weeks of use) among three brands of running shoes. To answer the question, the runner randomly selected six runners and assigned them to wear each of the three brands of running shoes until the shoes wore out. Each of the runners wore the brands of shoes in a random order.
After the data had been recorded, the following output was generated using statistical software:
Two-way Analysis of Variance
-Refer to Running Shoes Narrative. What are the treatments?
(Short Answer)
4.8/5 (33)
Salary of Business Graduates Narrative
An economist wants to test whether the mean starting salary (in $1000s) of business graduates is the same for three different majors and three types of class standing (top third, middle third, lowest third). No interaction is assumed. Appropriate sampling reveals the data shown below.
Starting Salaries (thousands of dollars per year)
-Refer to Salary of Business Graduates Narrative. Do the data present sufficient evidence to indicate differences among the treatment means? Justify your response. (Test using α = 0.05.)
(Essay)
4.7/5 (37)
Headache Treatments Narrative
The following data were generated from a 2 * 2 factorial experiment with three replicates, where factor A levels represent two different injection procedures of an anesthetic to the occipital nerve (located in the back of the neck), and factor B levels represent two different drugs that physicians recommend to increase the effectiveness of the injections. Three headache patients were randomly selected for each combination of injection and drug.
Factor B  -Refer to Headache Treatments Narrative. Test at the 5% significance level to determine if differences exist among the four treatment means.
(Essay)
4.7/5 (37)
Lifetime of Brake Shoes Narrative
An automobile parts store was interested in comparing the mean life length of three brands of automobile brake shoes. The following data represent the life length, measured in 1000s of kilometres, of random samples of six sets of brake shoes of each brand:  -Refer to Lifetime of Brake Shoes Narrative. Use statistical software to produce the ANOVA Table.
(Essay)
4.9/5 (44)
Ann Day wishes to determine if the mean price of grocery items is the same for five supermarkets in her city. The same seven food (and brand) items were priced at the five stores. Complete the partial ANOVA table below for testing the null hypothesis of no difference in the true mean price for the five stores in a completely randomized design. Can you reject the null hypothesis? Use  = 0.05.
(Essay)
4.9/5 (42)
Manufacturing Plant Machines
A mechanical engineer at a manufacturing plant keeps a close watch on the performance and condition of the machines. The following data are the weight losses (in milligrams) of certain machine parts due to friction when used with three different lubricants. 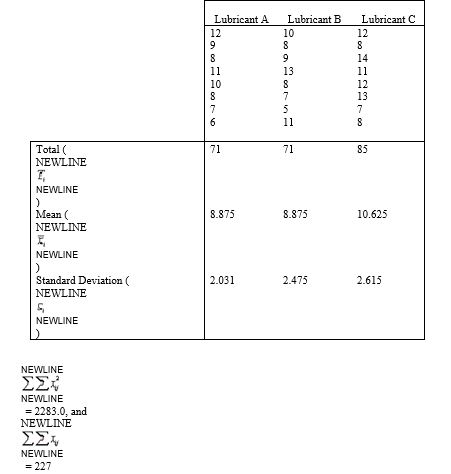 -Refer to Manufacturing Plant Machines graphics. Set up the ANOVA Table.
(Essay)
4.8/5 (30)
Insurance Company Narrative
An insurance company is considering opening a new branch in Lethbridge. The company will choose the final location from two locations within the city. One of the factors in the decision is the annual family income (in thousands of dollars) of five families randomly sampled from a radius of five miles from the potential locations.  -Refer to Insurance Company Narrative. Perform an equal-variances t test at the 5% significance level to determine whether the population means differ.
(Essay)
4.8/5 (36)
Filters
- Essay(0)
- Multiple Choice(0)
- Short Answer(0)
- True False(0)
- Matching(0)