Exam 11: B: The Analysis of Variance
Exam 1: Describing Data With Graphs134 Questions
Exam 2: Describing Data With Numerical Measures235 Questions
Exam 3: Describing Bivariate Data57 Questions
Exam 4: A: probability and Probability Distributions107 Questions
Exam 4: B: probability and Probability Distributions157 Questions
Exam 5: Several Useful Discrete Distributions166 Questions
Exam 6: The Normal Probability Distribution235 Questions
Exam 7: Sampling Distributions231 Questions
Exam 8: Large-Sample Estimation187 Questions
Exam 9: A: large-Sample Tests of Hypotheses154 Questions
Exam 9: B: large-Sample Tests of Hypotheses106 Questions
Exam 10: A: Inference From Small Samples192 Questions
Exam 10: B: Inference From Small Samples124 Questions
Exam 11: A: The Analysis of Variance136 Questions
Exam 11: B: The Analysis of Variance137 Questions
Exam 12: A: linear Regression and Correlation131 Questions
Exam 12: B: linear Regression and Correlation171 Questions
Exam 13: Multiple Regression Analysis232 Questions
Exam 14: Analysis of Categorical Data158 Questions
Exam 15: A:nonparametric Statistics139 Questions
Exam 15: B:nonparametric Statistics95 Questions
Select questions type
Laundry Detergent Preference Narrative
A consumer would like to know if there is a difference in the performance of three different laundry detergents. Eighteen pieces of white cloth were soiled with grape juice then washed in one of the three detergents A, B, or C. The resulting whiteness readings are listed below, where the larger number indicates whiter fabric.  -Refer to Laundry Detergent Preference Narrative. Set up the ANOVA Table.
(Essay)
4.7/5  (34)
(34)
Absenteeism Narrative
The data shown below are collected using randomized design. The data values represent the number of days absent from work for three independent samples of workers.  -Refer to Absenteeism Narrative. Calculate SSE and MSE.
(Essay)
4.7/5 (33)
Healthy Dog Food Narrative
A premium dog food manufacturer claims that, since its food is so highly nutritious, you won't need to feed your dog as much as with other dog foods. The premium dog food was compared to three other brands with respect to how much a dog needed to eat, in kilograms per week, to maintain its current weight and for the dog to remain healthy. A random sample of 24 similar dogs was selected and divided into 4 groups (i.e., 6 dogs were randomly assigned to each dog food brand). The following partial analysis table was computed:
Analysis of Variance for Dog Food Brands  -Refer to Healthy Dog Food Narrative. Complete the ANOVA table.
(Essay)
4.9/5 (36)
Healthy Dog Food Narrative
A premium dog food manufacturer claims that, since its food is so highly nutritious, you won't need to feed your dog as much as with other dog foods. The premium dog food was compared to three other brands with respect to how much a dog needed to eat, in kilograms per week, to maintain its current weight and for the dog to remain healthy. A random sample of 24 similar dogs was selected and divided into 4 groups (i.e., 6 dogs were randomly assigned to each dog food brand). The following partial analysis table was computed:
Analysis of Variance for Dog Food Brands
-Refer to Healthy Dog Food Narrative. Set up the rejection region using  = 0.05.
(Essay)
4.9/5 (33)
Laundry Detergent Preference Narrative
A consumer would like to know if there is a difference in the performance of three different laundry detergents. Eighteen pieces of white cloth were soiled with grape juice then washed in one of the three detergents A, B, or C. The resulting whiteness readings are listed below, where the larger number indicates whiter fabric.
-Refer to Laundry Detergent Preference Narrative. Develop and interpret a 95% confidence interval for  .
.
(Essay)
4.8/5 (38)
UBC Building Signs Narrative
A researcher at University of British Columbia (UBC) wanted to determine whether different building signs (building maps versus wall signage) affect the total amount of time visitors require to reach their destination and whether that time depends on whether the starting location is inside or outside the building. Three subjects were assigned to each of the combinations of signs and starting locations, and travel time in seconds from beginning to destination was recorded. A partial computer output of the appropriate analysis is given below:
ANOVA Table  -Refer to UBC Building Signs Narrative. In order to determine the critical value of the F ratio against which to test for interaction between levels of factor A and levels of factor B, which numerator of df and which denominator of F should we use?
(Short Answer)
4.8/5 (24)
Fuel Consumption Study Narrative
A study was conducted to compare fuel consumption of medium-size trucks for three brands of gasoline, A, B, and C. Four trucks of the same make and model were used in the experiment, and each gasoline brand was tested in each truck. Using each brand in the same truck has the effect of eliminating (blocking out) truck-to-truck variability. The data (litres per 100 km) are as follow:
Automobile  -Refer to Fuel Consumption Study Narrative. Use statistical software to generate a summary table and the ANOVA table.
(Essay)
5.0/5 (26)
Manufacturing Plant Machines
A mechanical engineer at a manufacturing plant keeps a close watch on the performance and condition of the machines. The following data are the weight losses (in milligrams) of certain machine parts due to friction when used with three different lubricants. 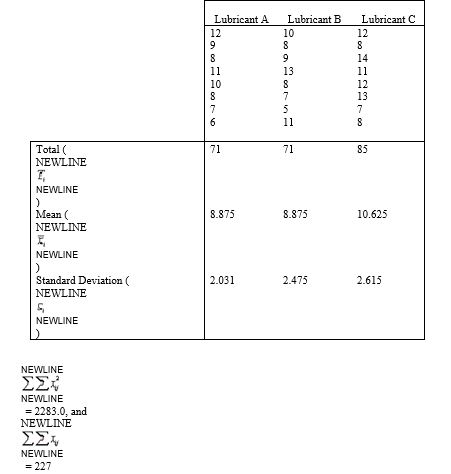 -Refer to Manufacturing Plant Machines graphics. What is the appropriate conclusion for the test?
(Essay)
4.7/5 (31)
In order to examine the differences in ages of teachers among five school districts, an educational statistician took random samples of six teachers' ages in each district. The data are listed below.
Ages of Teachers among Five School Districts  Use Tukey's multiple comparison method to determine which means differ.
(Essay)
4.8/5 (34)
Breaking Strength of Thread Narrative
A textile company is interested in knowing if there is a difference in the breaking strength of four different kinds of thread. 
 = 6605.02, and
  = 362.2
-Refer to Breaking Strength of Thread Narrative. Find and interpret the approximate p-value.
= 362.2
-Refer to Breaking Strength of Thread Narrative. Find and interpret the approximate p-value.
(Essay)
4.7/5 (36)
An automobile parts store was interested in comparing the mean life length of three brands of automobile brake shoes. The following data represent the life length, measured in thousands of kilometres, of random samples of six sets of brake shoes of each brand:  Use the following output from statistical software to determine which of the means differ at the 0.05 level of significance.
Tukey's pairwise comparisons
Family error rate = 0.0500
Individual error rate = 0.0203
Critical value = 3.67
Intervals for (column level mean) - (row level mean)
Use the following output from statistical software to determine which of the means differ at the 0.05 level of significance.
Tukey's pairwise comparisons
Family error rate = 0.0500
Individual error rate = 0.0203
Critical value = 3.67
Intervals for (column level mean) - (row level mean) 
(Essay)
4.9/5 (30)
UBC Building Signs Narrative
A researcher at University of British Columbia (UBC) wanted to determine whether different building signs (building maps versus wall signage) affect the total amount of time visitors require to reach their destination and whether that time depends on whether the starting location is inside or outside the building. Three subjects were assigned to each of the combinations of signs and starting locations, and travel time in seconds from beginning to destination was recorded. A partial computer output of the appropriate analysis is given below:
ANOVA Table
-Refer to UBC Building Signs Narrative. Find the degrees of freedom for the different building signs.
(Short Answer)
4.8/5 (36)
Supermarket Prices Narrative
A building contractor employs three construction engineers, A, B, and C to estimate and bid on jobs. To determine whether one tends to be a more conservative (or liberal) estimator than the others, the contractor selects four projected construction jobs and has each estimator independently estimate the cost (in dollars per square foot) of each job. The data are shown in the table:
Construction Job  -Refer to Supermarket Prices Narrative. Complete the ANOVA table below where the grocery items were treated as blocks. Can you reject the null hypothesis of no difference between the true mean price for the five stores? Use = 0.05.
(Essay)
4.9/5 (34)
Water Samples Narrative
Water samples were taken at four different locations in a river to determine whether the quantity of dissolved oxygen, a measure of water pollution, varied from one location to another. Locations 1 and 2 were selected above an industrial plant, one near the shore and the other in midstream; location 3 was adjacent to the industrial water discharge for the plant; and location 4 was slightly downriver in midstream. Five water specimens were randomly selected at each location, but one specimen, corresponding to location 4, was lost in the laboratory. The data and an ANOVA computer printout are provided here (the greater the pollution, the lower the dissolved oxygen readings). 

 -Refer to Water Samples Narrative. Compare the mean dissolved oxygen content in midstream above the plant with the mean content adjacent to the plant (location 2 versus location 3). Use a 95% confidence interval.
(Essay)
4.9/5 (45)
Breaking Strength of Thread Narrative
A textile company is interested in knowing if there is a difference in the breaking strength of four different kinds of thread. = 6605.02, and = 362.2
-Refer to Breaking Strength of Thread Narrative. State the null and alternative hypotheses to test whether there is a significant difference in mean breaking strength of the four kinds of thread.
(Essay)
4.9/5 (35)
Keyboard and Word Processing Narrative
The data shown below were taken from a 2 * 3 factorial experiment to examine the effects of factor A (keyboard configuration, 3 levels) and factor B (word processing package, 2 levels). Each cell consists of four replicates, representing the number of minutes each of four secretaries randomly assigned to that cell required to type a standard document.
Factor B  -Refer to Keyboard and Word Processing Narrative. Test at the 5% significance level to determine if differences exist among the levels of factor B.
(Essay)
4.8/5 (37)
Breaking Strength of Thread Narrative
A textile company is interested in knowing if there is a difference in the breaking strength of four different kinds of thread. = 6605.02, and = 362.2
-Refer to Breaking Strength of Thread Narrative. Set up the rejection region for  = 0.05.
(Essay)
4.8/5 (38)
Filters
- Essay(0)
- Multiple Choice(0)
- Short Answer(0)
- True False(0)
- Matching(0)