Exam 10: B: Inference From Small Samples
Exam 1: Describing Data With Graphs134 Questions
Exam 2: Describing Data With Numerical Measures235 Questions
Exam 3: Describing Bivariate Data57 Questions
Exam 4: A: probability and Probability Distributions107 Questions
Exam 4: B: probability and Probability Distributions157 Questions
Exam 5: Several Useful Discrete Distributions166 Questions
Exam 6: The Normal Probability Distribution235 Questions
Exam 7: Sampling Distributions231 Questions
Exam 8: Large-Sample Estimation187 Questions
Exam 9: A: large-Sample Tests of Hypotheses154 Questions
Exam 9: B: large-Sample Tests of Hypotheses106 Questions
Exam 10: A: Inference From Small Samples192 Questions
Exam 10: B: Inference From Small Samples124 Questions
Exam 11: A: The Analysis of Variance136 Questions
Exam 11: B: The Analysis of Variance137 Questions
Exam 12: A: linear Regression and Correlation131 Questions
Exam 12: B: linear Regression and Correlation171 Questions
Exam 13: Multiple Regression Analysis232 Questions
Exam 14: Analysis of Categorical Data158 Questions
Exam 15: A:nonparametric Statistics139 Questions
Exam 15: B:nonparametric Statistics95 Questions
Select questions type
Price Differences Narrative
A consumer was interested in determining whether there is a significant difference in the price charged for tools by two hardware stores. The consumer selected five tools and recorded the price for each tool in each store. The following data were recorded:
Tool  -Refer to Price Differences Narrative. Perform the appropriate test of hypothesis to determine whether there is a significant difference, on average, in the price of tools between the two stores. Use
  = 0.05.
(Essay)
4.7/5  (36)
(36)
Price Differences Narrative
A consumer was interested in determining whether there is a significant difference in the price charged for tools by two hardware stores. The consumer selected five tools and recorded the price for each tool in each store. The following data were recorded:
Tool
-Refer to Price Differences Narrative. Are the samples independent? Justify your answer.
(Essay)
4.8/5 (31)
Quiz Scores Narrative
Two independent random samples of sizes  = 4 and
  = 5 are selected from two normal populations. The data below represent the scores in a 20-point quiz.
  -Refer to Quiz Scores Narrative. Test
  for
for  = 0.05. State and justify your conclusions.
(Essay)
4.9/5 (27)
Test Scores Narrative
The test scores on a 100-point test were recorded for 20 students: 73, 95, 93, 83, 77, 75, 83, 84, 78, 59, 86, 91, 69, 64, 74, 79, 70, 67, 77, and 86.
-Refer to Test Scores Narrative. Can you reasonably assume that these test scores have been selected from a normal population? Use a stem and leaf plot to justify your answer.
(Essay)
4.9/5 (41)
Contact Lenses Narrative
Two different brands of contact lenses are to be compared for length, in hours, of comfortable wear. The lenses are available in any prescription.
-Refer to Contact Lenses Narrative. How might an experiment resulting in paired data be carried out?
(Essay)
4.9/5 (27)
Average Fuel Consumption
The average fuel consumption of a 4-wheel drive truck is 12.9 L/100 km. The average fuel consumption for seven randomly selected trucks is 13.5, 13.0, 12.6, 12.2, 12.8, 12.9, and 13.1. Assume the fuel consumption distribution is normal. The researcher wishes to know if the sample data suggest that the average fuel consumption is different from 12.9 L/100 km.
-Please refer to the Average Fuel Consumption paragraph. Compute the approximate p-value associated with the test statistic in the previous question. Do the sample data support the null hypothesis at the  = 0.05 level? Justify your conclusion.
(Essay)
4.8/5 (36)
Average Battery Life Narrative
The average life of a certain type and brand of battery is 75 weeks. The average life of each of nine randomly selected batteries is as follows: 74.5, 75.0, 72.3, 76.0, 75.2, 75.1, 75.3, 74.9, and 74.8. Assume the battery life distribution is normal. Do the sample data suggest the average life is smaller than 75 weeks?
-Refer to Average Battery Life Narrative. State the appropriate hypotheses.
(Essay)
4.8/5 (35)
Interest Rates Narrative
The following 10 observations are interest rates on unpaid balances on credit cards for a department store: 10.4, 10.1, 9.5, 10.5, 10.6, 9.3, 9.9, 10.7, 9.5, and 10.0.
-Refer to Interest Rates Narrative. Find a 99% confidence interval for the population mean  , and explain how to use it for testing
  vs.
vs.  using
using 
(Essay)
4.8/5 (32)
Vertical Blinds Installation Narrative
A drapery store manager was interested in determining whether a new employee can install vertical blinds faster than an employee who has been with the company for two years. The manager takes independent samples of ten vertical blind installations of each of the two employees and computes the following information.  -Refer to Vertical Blinds Installation Narrative. Is it reasonable to assume equality of variances in this ? Justify your answer.
(Essay)
4.8/5 (41)
Bottling Productivity Narrative
Five soft drink bottling companies have agreed to implement a time management program in hopes of increasing productivity (measured in cases of soft drinks bottled per hour). The number of cases of soft drinks bottled per hour before and after the implementation of the program are listed below:
Company  -Refer to Bottling Productivity Narrative. What is the appropriate conclusion? Justify your answer.
(Essay)
4.9/5 (32)
Running Shoes Narrative
A new runner has decided to purchase a new pair of running shoes. He has narrowed his choices to two brands, each of which would be appropriate for his use. His concern is whether there is a significant difference in the average wear between the two brands of shoes. He enlists a random sample of six veteran runners to test the shoes. Each runner wore each brand of shoe until it wore out. The following data were recorded, representing the number of weeks each runner used each pair of shoes:
Runner  -Refer to Running Shoes Narrative. Find a 95% confidence interval for the difference in average wear length between the two brands of shoes. Based on this interval, can one conclude there is a significant difference in average wear length between the two brands of shoes? Justify your answer.
(Essay)
4.8/5 (33)
Laptop Battery Average Narrative
The manufacturer of a particular battery pack for laptop computers claims its battery pack can function for 8 hours, on average, before having to be recharged. A random sample of 16 battery packs was selected and tested. The mean functioning time before having to be recharged was 7.2 hours with a standard deviation of 1.9 hours.
-Refer to Laptop Battery Average Narrative. Based on the interval calculated above, can the manufacturer's claim be rejected? Justify your answer.
(Essay)
4.9/5 (24)
Employees Test Scores Narrative
A random sample of 35 employees who completed two years of college were asked to take a basic mathematics test. The mean and standard deviation of their scores were 75.1 and 12.8, respectively. In a random sample of 50 employees who completed only high school, the mean and standard deviation of the test scores were 72.1 and 14.6, respectively.
-Refer to Employees Test Scores Narrative. Explain how to use the interval estimate to test the hypotheses.
(Essay)
4.9/5 (40)
A random sample of seven observations was drawn from a normal population. The following summations were computed:  and
and 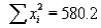 . Test the hypothesis
  vs.
vs.  at the 1% significance level.
(Essay)
4.8/5 (36)
Quiz Scores Narrative
Two independent random samples of sizes = 4 and = 5 are selected from two normal populations. The data below represent the scores in a 20-point quiz.
-Refer to Quiz Scores Narrative. Calculate  , the pooled estimator of
  .
.
(Essay)
4.8/5 (40)
Bottling Productivity Narrative
Five soft drink bottling companies have agreed to implement a time management program in hopes of increasing productivity (measured in cases of soft drinks bottled per hour). The number of cases of soft drinks bottled per hour before and after the implementation of the program are listed below:
Company
-Refer to Bottling Productivity Narrative. Calculate the value of the test statistic.
(Essay)
4.7/5 (31)
Children Narrative
Two random samples of 3-year-old children, each of size 25, are taken from independent populations. The populations are distributed with equal variances. The first sample has a mean of 35.5 and a standard deviation of 3.0 while the second sample has a mean 33.0 and standard deviation of 4.0. A test for the difference between the two population means is conducted on this data.
-Refer to Children Narrative. Compute the t statistic of this test.
(Short Answer)
5.0/5 (39)
Preservatives Narrative
A food processing plant wants to compare two preservatives for their effects on retarding spoilage. Suppose 16 cuts of fresh meat are treated with preservative A and 16 are treated with preservative B. The number of hours until spoilage begins is recorded for each of the 32 cuts of meat. The results are summarized in the table below.  -Refer to Preservatives Narrative. Assuming that the population variances are equal, which test would likely be most appropriate to employ to test the equality of the population means?
(Short Answer)
4.9/5 (38)
Let denote the true average number of minutes of a television commercial. Suppose the hypotheses 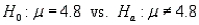 are tested. Assuming the commercial time is normally distributed, give the appropriate rejection region for each of the following sample sizes and significance levels.
a. n = 6,
are tested. Assuming the commercial time is normally distributed, give the appropriate rejection region for each of the following sample sizes and significance levels.
a. n = 6,  = 0.01
b. n = 12,
= 0.01
b. n = 12,  = 0.05
c. n = 20,
= 0.05
c. n = 20,  = 0.05
d. n = 23,
= 0.05
d. n = 23,  = 0.1
= 0.1
(Essay)
4.9/5 (39)
Average Battery Life Narrative
The average life of a certain type and brand of battery is 75 weeks. The average life of each of nine randomly selected batteries is as follows: 74.5, 75.0, 72.3, 76.0, 75.2, 75.1, 75.3, 74.9, and 74.8. Assume the battery life distribution is normal. Do the sample data suggest the average life is smaller than 75 weeks?
-Refer to Average Battery Life Narrative. Compute the test statistic for the hypotheses in the previous question.
(Essay)
4.8/5 (29)
Filters
- Essay(0)
- Multiple Choice(0)
- Short Answer(0)
- True False(0)
- Matching(0)