Exam 10: B: Inference From Small Samples
Exam 1: Describing Data With Graphs134 Questions
Exam 2: Describing Data With Numerical Measures235 Questions
Exam 3: Describing Bivariate Data57 Questions
Exam 4: A: probability and Probability Distributions107 Questions
Exam 4: B: probability and Probability Distributions157 Questions
Exam 5: Several Useful Discrete Distributions166 Questions
Exam 6: The Normal Probability Distribution235 Questions
Exam 7: Sampling Distributions231 Questions
Exam 8: Large-Sample Estimation187 Questions
Exam 9: A: large-Sample Tests of Hypotheses154 Questions
Exam 9: B: large-Sample Tests of Hypotheses106 Questions
Exam 10: A: Inference From Small Samples192 Questions
Exam 10: B: Inference From Small Samples124 Questions
Exam 11: A: The Analysis of Variance136 Questions
Exam 11: B: The Analysis of Variance137 Questions
Exam 12: A: linear Regression and Correlation131 Questions
Exam 12: B: linear Regression and Correlation171 Questions
Exam 13: Multiple Regression Analysis232 Questions
Exam 14: Analysis of Categorical Data158 Questions
Exam 15: A:nonparametric Statistics139 Questions
Exam 15: B:nonparametric Statistics95 Questions
Select questions type
Studying Time Narrative
A faculty advisor was interested in determining whether there is a difference between male and female students in the amount of time (in hours) spent studying on weeknights (Monday through Thursday). The advisor selected a random sample of 12 female students and a second random, but independent, sample of 10 male students and asked each student to indicate the average amount of time spent studying on a weeknight. The following summary statistics are obtained.  -Refer to Studying Time Narrative. The advisor assumed equal variances in the analysis. Is this a reasonable assumption? Justify your answer.
(Essay)
4.8/5  (35)
(35)
Children Narrative
Two random samples of 3-year-old children, each of size 25, are taken from independent populations. The populations are distributed with equal variances. The first sample has a mean of 35.5 and a standard deviation of 3.0 while the second sample has a mean 33.0 and standard deviation of 4.0. A test for the difference between the two population means is conducted on this data.
-Refer to Children Narrative. If we were interested in testing against the one-tailed alternative that  at the
  level of significance, should the null hypothesis be rejected or not be rejected?
(Short Answer)
4.7/5 (33)
Children Narrative
Two random samples of 3-year-old children, each of size 25, are taken from independent populations. The populations are distributed with equal variances. The first sample has a mean of 35.5 and a standard deviation of 3.0 while the second sample has a mean 33.0 and standard deviation of 4.0. A test for the difference between the two population means is conducted on this data.
-Refer to Children Narrative. What is the pooled variance?
(Short Answer)
4.9/5 (34)
Hourly Wages Narrative
A random sample of 15 hourly wages for waitresses (including tips) was drawn from a normal population. The sample mean and sample standard deviation were computed as  = $14.9 and s = $6.75.
-Refer to Hourly Wages Narrative. Can we infer at the 5% significance level that the population mean is greater than 12? Justify your conclusion.
= $14.9 and s = $6.75.
-Refer to Hourly Wages Narrative. Can we infer at the 5% significance level that the population mean is greater than 12? Justify your conclusion.
(Essay)
4.9/5 (32)
Assume that the population distributions of life expectancy (in years) of men and women are normal with equal variances. Two random samples, drawn independently from the populations, showed the following statistics.
Men:  = 10,
= 10,  = 76,
= 76,  = 1
Women:
= 1
Women:  = 10,
= 10,  = 83,
= 83,  = 4
Construct and interpret a 99% confidence interval for the true difference in average life expectancy of men and women.
= 4
Construct and interpret a 99% confidence interval for the true difference in average life expectancy of men and women.
(Essay)
4.9/5 (29)
Average Fuel Consumption
The average fuel consumption of a 4-wheel drive truck is 12.9 L/100 km. The average fuel consumption for seven randomly selected trucks is 13.5, 13.0, 12.6, 12.2, 12.8, 12.9, and 13.1. Assume the fuel consumption distribution is normal. The researcher wishes to know if the sample data suggest that the average fuel consumption is different from 12.9 L/100 km.
-Please refer to the Average Fuel Consumption paragraph. Compute the test statistic for the hypotheses in the previous question.
(Essay)
4.7/5 (32)
Cigarette Tar Content Narrative
Ten measurements of the tar content of a certain brand of cigarette are 13.5, 14.0, 13.9, 14.2, 15.1, 14.6, 13.8, 14.0, 14.1, and 14.7 in milligrams per cigarette. Assume these measurements were taken from a population with a normal distribution.
-Refer to Cigarette Tar Content Narrative. Interpret the interval in the previous question.
(Essay)
4.8/5 (35)
Preservatives Narrative
A food processing plant wants to compare two preservatives for their effects on retarding spoilage. Suppose 16 cuts of fresh meat are treated with preservative A and 16 are treated with preservative B. The number of hours until spoilage begins is recorded for each of the 32 cuts of meat. The results are summarized in the table below.  -Refer to Preservatives Narrative. Determine the rejection region at
  and write the proper conclusion.
(Essay)
4.7/5 (32)
Earthquake Analysis Narrative
The length of duration, in minutes, of earthquakes in British Columbia has been recorded for future analysis and information. The length of duration of a random sample of six earthquakes is as follows: 1.1, 0.9, 1.5, 0.7, 1.4, and 1.3.
-Refer to Earthquake Analysis Narrative. An earthquake expert claims that the average duration of earthquakes in British Columbia is 0.5 minutes. Based on the interval calculated above, can this claim be rejected? Justify your answer.
(Essay)
4.7/5 (29)
Test Scores Narrative
The test scores on a 100-point test were recorded for 20 students: 73, 95, 93, 83, 77, 75, 83, 84, 78, 59, 86, 91, 69, 64, 74, 79, 70, 67, 77, and 86.
-Refer to Test Scores Narrative If these students can be considered a random sample from the population of all students, find a 95% confidence interval for the average test score in the population.
(Essay)
4.8/5 (31)
Studying Time Narrative
A faculty advisor was interested in determining whether there is a difference between male and female students in the amount of time (in hours) spent studying on weeknights (Monday through Thursday). The advisor selected a random sample of 12 female students and a second random, but independent, sample of 10 male students and asked each student to indicate the average amount of time spent studying on a weeknight. The following summary statistics are obtained.
-Refer to Studying Time Narrative. Using the p-value approach and = 0.10, what conclusion can be drawn about the difference between male and female students in average time spent studying on weeknights?
(Essay)
4.9/5 (37)
Price Differences Narrative
A consumer was interested in determining whether there is a significant difference in the price charged for tools by two hardware stores. The consumer selected five tools and recorded the price for each tool in each store. The following data were recorded:
Tool  -In a study to compare average snowfall in two different Canadian cities in December, measurements were taken in each of the cities for ten randomly selected years. Snowfalls, in centimetres, for the two cities are listed below. Assume the two population distributions are normal. Use the data to determine if there is a significant difference in average snowfall in the two cities. Use a significance level of = 0.05.
(Essay)
4.8/5 (35)
During a water shortage, a water company randomly sampled residential water meters in order to monitor daily water consumption. On a particular day, a sample of 25 meters showed a sample mean of 750 litres and a sample standard deviation of 150 litres. Provide a 90% confidence interval estimate of the mean water consumption for the population.
(Essay)
4.8/5 (44)
Contact Lenses Narrative
Two different brands of contact lenses are to be compared for length, in hours, of comfortable wear. The lenses are available in any prescription.
-Refer to Contact Lenses Narrative. How might an independent samples experiment be carried out?
(Essay)
4.9/5 (34)
Let denote the true average number of minutes of a television commercial. Suppose the hypotheses 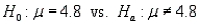 are tested. Assuming the commercial time is normally distributed, give the appropriate rejection region for each of the following sample sizes and significance levels.
a. n = 6,
are tested. Assuming the commercial time is normally distributed, give the appropriate rejection region for each of the following sample sizes and significance levels.
a. n = 6,  = 0.01
b. n = 12,
= 0.01
b. n = 12,  = 0.05
c. n = 20,
= 0.05
c. n = 20,  = 0.05
d. n = 23,
= 0.05
d. n = 23,  = 0.1
= 0.1
(Essay)
4.9/5 (33)
Coffee Vending Machines Narrative
An automatic coffee vending machine dispenses a different amount of coffee in millilitres (mL) for each cup. Assume the following nine measurements were taken from a population with a normal distribution: 185, 170, 196, 176, 173, 187, 193, 170 and 173 mL.
-Refer to Coffee Vending Machines Narrative. Interpret the interval in the previous question.
(Essay)
4.8/5 (25)
Interest Rates Narrative
The following 10 observations are interest rates on unpaid balances on credit cards for a department store: 10.4, 10.1, 9.5, 10.5, 10.6, 9.3, 9.9, 10.7, 9.5, and 10.0.
-Refer to Interest Rates Narrative. Calculate the test statistic , specify the rejection region and then test the hypothesis 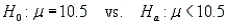 . Use
. Use  = 0.01.
(Essay)
4.8/5 (40)
A scientist is testing two different types of Secchi discs. This is an instrument used for determining water clarity. The scientist takes a depth reading (in metres below the surface) with each disc at eight different locations on a lake. The results of the eight different locations for each Secchi disc are listed below. Assume the two population distributions are normal. Determine if there is a significant difference in average depth reading for the two discs. Use a significance level of  = 0.01.
(Essay)
5.0/5 (34)
Manufacturing Garment Average Narrative
A garment manufacturing company recorded the amount of time that it took to make a pair of jeans on eight different occasions. The times in minutes are as follows: 12.5, 13.0, 11.9, 10.2, 13.1, 13.6, 13.8, and 14.0. Assume these measurements were taken from a population with a normal distribution. Do the sample data suggest that the average time it takes this company to make a pair of jeans is less than 13.5 minutes?
-Refer to Manufacturing Garment Average Narrative. Compute the test statistic for the hypotheses in the previous question.
(Essay)
4.8/5 (24)
Manufacturing Garment Average Narrative
A garment manufacturing company recorded the amount of time that it took to make a pair of jeans on eight different occasions. The times in minutes are as follows: 12.5, 13.0, 11.9, 10.2, 13.1, 13.6, 13.8, and 14.0. Assume these measurements were taken from a population with a normal distribution. Do the sample data suggest that the average time it takes this company to make a pair of jeans is less than 13.5 minutes?
-Refer to Manufacturing Garment Average Narrative. Do the sample data support the alternative hypothesis at the  = 0.05 level? Justify your conclusion.
(Essay)
4.8/5 (29)
Filters
- Essay(0)
- Multiple Choice(0)
- Short Answer(0)
- True False(0)
- Matching(0)