Exam 11: The Is Curve
Exam 1: Introduction to Macroeconomics35 Questions
Exam 2: Measuring the Macroeconomy114 Questions
Exam 3: An Overview of Long-Run Economic Growth110 Questions
Exam 4: A Model of Production129 Questions
Exam 5: The Solow Growth Model126 Questions
Exam 6: Growth and Ideas120 Questions
Exam 7: The Labor Market, Wages, and Unemployment119 Questions
Exam 8: Inflation117 Questions
Exam 9: An Introduction to the Short Run113 Questions
Exam 10: The Great Recession: a First Look108 Questions
Exam 11: The Is Curve128 Questions
Exam 12: Monetary Policy and the Phillips Curve135 Questions
Exam 13: Stabilization Policy and the Asad Framework113 Questions
Exam 14: The Great Recession and the Short-Run Model112 Questions
Exam 15: Dsge Models: the Frontier of Business Cycle Research119 Questions
Exam 16: Consumption109 Questions
Exam 17: Investment116 Questions
Exam 18: The Government and the Macroeconomy122 Questions
Exam 19: International Trade107 Questions
Exam 20: Exchange Rates and International Finance142 Questions
Exam 21: Parting Thoughts35 Questions
Select questions type
According to the life-cycle and permanent-income hypotheses, if future income rises permanently, current consumption:
(Multiple Choice)
4.8/5  (34)
(34)
Refer to the following figure when answering the following questions.
Figure 11.6: IS Curve 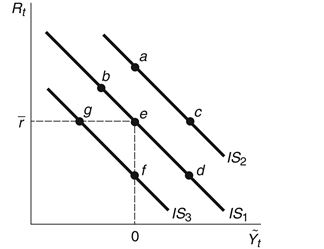 -Consider the IS curve in Figure 11.6. Holding the real interest rate constant, beginning at point e, if there is an aggregate demand shock:
(Multiple Choice)
4.8/5 (35)
Derive Hicks's IS relationship, beginning with the national income identity.
(Essay)
4.9/5 (46)
Consider the following model of the IS curve without an international sector:
Consumption: 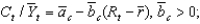 Investment:
 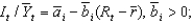 and
Government expenditure:
and
Government expenditure:  With this formulation, the IS curve is less steeply sloped than the "standard" IS curve.
(True/False)
5.0/5 (29)
U.S. government spending on goods and services does NOT include:
(Multiple Choice)
4.7/5 (32)
Refer to the following figure when answering the following questions.
Figure 11.7: Life Cycle Hypothesis  -Consider Figure 11.7 of the life-cycle hypothesis. Area(s) ________ is/are (a) period(s) of ________, and area(s) ________ is/are (a) period(s) of ________.
(Multiple Choice)
4.9/5 (45)
In the late 1970s, the United States experienced a productivity slowdown that decreased the marginal product capital. This caused:
(Multiple Choice)
4.8/5 (38)
Using the IS curve 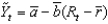 , in the long run,
  ________ and ________, so that
  ________.
(Multiple Choice)
4.8/5 (40)
Refer to the following figure when answering the following questions.
Figure 11.3: IS Curve 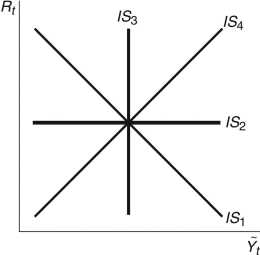 -Consider Figure 11.3. If investment is infinitely interest rate sensitive, the economy would be characterized by:
(Multiple Choice)
4.8/5 (30)
Refer to the following figure when answering the following questions.
Figure 11.7: Life Cycle Hypothesis
-Consider Figure 11.7 of the life-cycle hypothesis. Area(s) ________ is/are (a) period(s) of ________, and area(s) ________ is/are (a) period(s) of ________.
(Multiple Choice)
4.9/5 (46)
Consider the following model of the IS curve without an international sector:
Consumption:  Investment:
  and
Government expenditure:
and
Government expenditure:  .
With this formulation, the IS curve is horizontal.
.
With this formulation, the IS curve is horizontal.
(True/False)
4.8/5 (32)
The IS curve describes the ________ relationship between ________ and ________.
(Multiple Choice)
4.8/5 (23)
When there is a change to potential output, the IS curve shifts.
(True/False)
4.7/5 (36)
During a recession, increases in unemployment insurance, welfare, and Medicaid payments are called:
(Multiple Choice)
4.9/5 (33)
Consider Figure 11.8 below, which shows the output gap and the NASDAQ stock market index from 1995-2001. NASDAQ has a lot of "tech" firms that drove the rise in the stock market index in the late 1990s, as shown. As one can see, the output gap also rose to about 2.8 percent in April 2000. Explain this graph using the IS curve.Figure 11.8: Output Gap and NASDQ Index 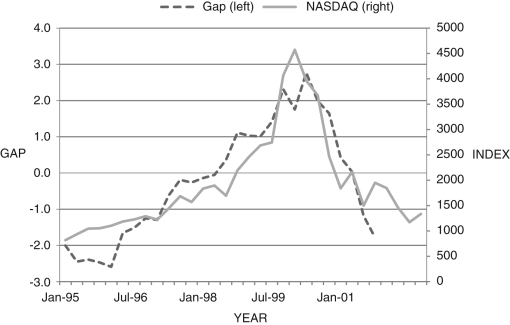
(Essay)
4.9/5 (38)
The foundation of the IS curve is the national income identity given by the equation  .
.
(True/False)
4.7/5 (40)
Filters
- Essay(0)
- Multiple Choice(0)
- Short Answer(0)
- True False(0)
- Matching(0)