Exam 8: Forecasting
Exam 1: Using Operations to Create Value100 Questions
Exam 2: Process Strategy and Analysis245 Questions
Exam 3: Quality and Performance195 Questions
Exam 4: Capacity Planning108 Questions
Exam 5: Constraint Management136 Questions
Exam 6: Lean Systems164 Questions
Exam 7: Project Management140 Questions
Exam 8: Forecasting150 Questions
Exam 9: Inventory Management207 Questions
Exam 10: Operations Planning and Scheduling149 Questions
Exam 11: Resource Planning125 Questions
Exam 12: Supply Chain Design77 Questions
Exam 13: Supply Chain Logistic Networks114 Questions
Exam 14: Supply Chain Integration111 Questions
Exam 15: Supply Chain Sustainability73 Questions
Exam 16: Decision Making107 Questions
Exam 17: Waiting Lines108 Questions
Exam 18: Special Inventory Models53 Questions
Exam 19: Linear Programming86 Questions
Exam 20: Simulation54 Questions
Exam 21: Financial Analysis55 Questions
Exam 22: Acceptance Sampling Plans87 Questions
Exam 23: Measuring Output Rates106 Questions
Exam 24: Learning Curve Analysis51 Questions
Exam 25: Operations Scheduling120 Questions
Exam 26: Layout36 Questions
Select questions type
The ________ is a process of gaining consensus from a group of experts while maintaining their anonymity.
Free
(Essay)
4.7/5  (34)
(34)
Correct Answer: Verified
Delphi method
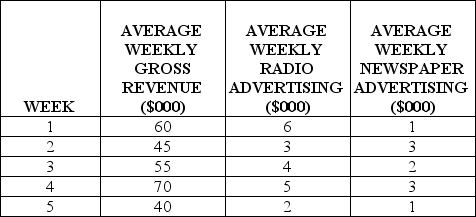
Table 8.4
The Furniture Super Mart is a furniture retailer in Evansville,Indiana.The Marketing Manager wants to prepare a media budget based on the next quarter's business plan.The manager wants to decide the mix of radio advertising and newspaper advertising needed to generate varying levels of Weekly Gross Revenue.The manager has collected data for the past five weeks,and has recorded the following average Weekly Gross Revenues and expenditures for Weekly Radio (X1)and Newspaper (X2)advertising:
 The Manager uses the multiple regression model in OM Explorer and obtains the following results:
 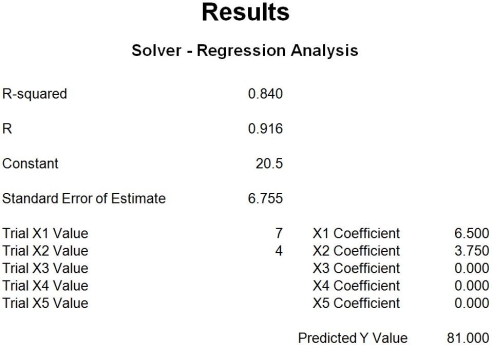 -Use the information provided in Table 8.4.Adding $1,000 of Weekly Newspaper Advertising (X2)can be expected to increase Weekly Gross Revenues by what amount? (Assume all other variables are held constant. )
Free
(Multiple Choice)
4.9/5 (31)
Correct Answer:Verified
B
Table 8.5 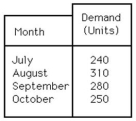 -Use the information in Table 8.5.Using the simple moving-average technique for the most recent three months,what will be the forecasted demand for November?
Free
(Multiple Choice)
4.8/5 (34)
Correct Answer:Verified
C
________ is a causal method of forecasting in which one variable is related to one or more variables by a linear equation.
(Essay)
4.9/5 (36)
Judgment methods of forecasting are quantitative methods that use historical data on independent variables to predict demand.
(True/False)
4.7/5 (28)
Draw a curve that represents four out of the five demand patterns for time series as discussed in this chapter.Clearly label both dependent and independent axis and the salient features of your graph that demonstrate your chosen patterns.Select a product or service and discuss what influences might cause it to exhibit each of these patterns.
(Essay)
4.8/5 (32)
Graph 8.1
Data plotted in the graph appear in the table below. 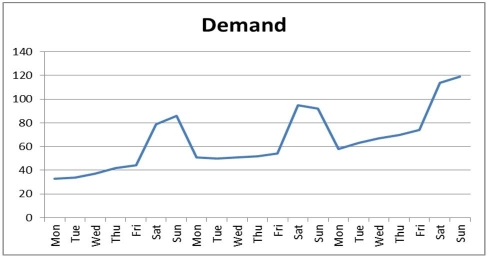
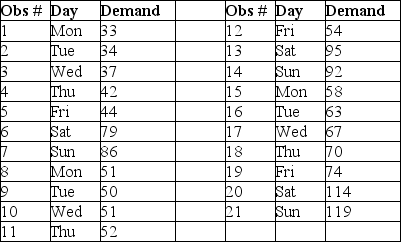 -Refer to Graph 8.1.Which term most accurately describes the data points associated with Saturdays and Sundays?
(Multiple Choice)
4.8/5 (29)
Which one of the following statements about forecasting is FALSE?
(Multiple Choice)
4.8/5 (34)
Table 8.7
A sales manager wants to forecast monthly sales of the machines the company makes using the following monthly sales data.
 -Use the information in Table 8.7.What is the forecast for period 9 using a naive forecast?
(Multiple Choice)
4.9/5 (38)
Market research is a systematic approach to determine consumer interest by gaining consensus from a group of experts while maintaining their anonymity.
(True/False)
4.9/5 (37)
A forecasting system that brings the manufacturer and its customers together to provide input for forecasting is a(n):
(Multiple Choice)
4.8/5 (31)
Table 8.5
-Use the information in Table 8.5.Using the exponential smoothing method,with alpha equal to 0.2,what is the forecasted demand for November? Use an initial value for the forecast equal to 277 units.
(Multiple Choice)
4.9/5 (32)
The number of #2 pencils the bookstore sells appears to be highly correlated with the number of student credit hours each semester.The bookstore manager wants to create a linear regression model to assist her in placing an appropriate order.In this scenario:
(Multiple Choice)
4.9/5 (25)
When the underlying mean of a time series is very stable and there are no trend,cyclical,or seasonal influences:
(Multiple Choice)
4.9/5 (34)
________ are produced by averaging independent forecasts based on different methods or different data,or both.
(Essay)
4.9/5 (29)
A(n)________ forecast is a time-series method whereby the forecast for the next period equals the demand for the current period.
(Essay)
4.9/5 (32)
Variations in demand that cannot be predicted are said to be a(n)________ pattern.
(Essay)
4.8/5 (31)
Filters
- Essay(0)
- Multiple Choice(0)
- Short Answer(0)
- True False(0)
- Matching(0)