Exam 2: Process Strategy and Analysis
Exam 1: Using Operations to Create Value100 Questions
Exam 2: Process Strategy and Analysis245 Questions
Exam 3: Quality and Performance195 Questions
Exam 4: Capacity Planning108 Questions
Exam 5: Constraint Management136 Questions
Exam 6: Lean Systems164 Questions
Exam 7: Project Management140 Questions
Exam 8: Forecasting150 Questions
Exam 9: Inventory Management207 Questions
Exam 10: Operations Planning and Scheduling149 Questions
Exam 11: Resource Planning125 Questions
Exam 12: Supply Chain Design77 Questions
Exam 13: Supply Chain Logistic Networks114 Questions
Exam 14: Supply Chain Integration111 Questions
Exam 15: Supply Chain Sustainability73 Questions
Exam 16: Decision Making107 Questions
Exam 17: Waiting Lines108 Questions
Exam 18: Special Inventory Models53 Questions
Exam 19: Linear Programming86 Questions
Exam 20: Simulation54 Questions
Exam 21: Financial Analysis55 Questions
Exam 22: Acceptance Sampling Plans87 Questions
Exam 23: Measuring Output Rates106 Questions
Exam 24: Learning Curve Analysis51 Questions
Exam 25: Operations Scheduling120 Questions
Exam 26: Layout36 Questions
Select questions type
How could a fishbone chart be used to design a new process?
Free
(Essay)
4.9/5  (31)
(31)
Correct Answer: Verified
Also called a cause-and-effect diagram,the classic fishbone chart relates a key quality problem to its potential causes.Instead of placing a problem at the head of the fish,instead the process designers might place the desired process outcome at the head of the fish,e.g. ,"100% accuracy in order fulfillment" and then fill out the skeletal structure with elements that can help achieve this desired process outcome.
Process ________ is the boundary of the process to be analyzed.
Free
(Essay)
4.9/5 (38)
Correct Answer:Verified
scope
Scenario 2.3
A job consists of three elements.Twenty observations for each element were timed,and the resulting data are shown in the following table.A performance rating has also been assigned for each element,as shown in the table.The job has an allowance of 15% of normal time.
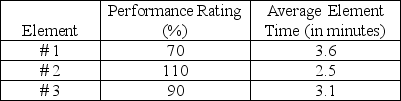 -Use the information in Scenario 2.3.What is the normal time for the entire job?
Free
(Multiple Choice)
4.9/5 (32)
Correct Answer:Verified
C
Process analysis is the documentation and detailed understanding of how work is performed and how it can be redesigned.
(True/False)
4.8/5 (39)
Capital intensive automation is appropriate for high and low volume operations.
(True/False)
4.9/5 (44)
The break-even graph shown below represents the cost structure associated with a flexible production process and one that is fixed (less flexible).Using the information displayed in the graph,determine the cost structures associated with the two alternative production methods. 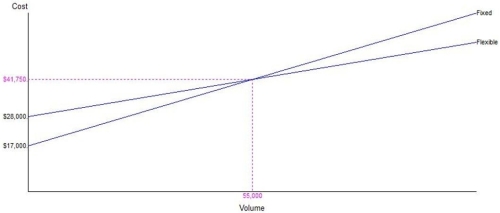
(Essay)
4.9/5 (34)
A(n)________ process would probably not be used to produce products before a customer has placed a firm order.
(Essay)
4.8/5 (24)
A front office structure features high levels of customer contact where the service provider interacts directly with the internal or external customer.
(True/False)
4.9/5 (40)
A farmer that has been well-trained in the scientific method divides his acreage into several plots and plants the same variety of hay in each.He varies the amount of fertilizer applied to each plot and carefully records the yield,in bales per acre,for each of the plots.Which of these tools would be the best to help him analyze the effect of fertilizer application on hay yield?
(Multiple Choice)
4.9/5 (28)
Two manufacturing processes are being considered for making a new product.Process #1 is less capital intensive,with fixed costs of $50,000 per year and variable costs of $700 per unit.Process #2 has fixed costs of $400,000 annually,with variable costs of $200 per unit.
a.What is the break-even quantity for the two processes?
b.If annual sales are expected to be 600 units,which process should be selected?
c.If lowest overall costs per year is your overall objective,for what range of annual production quantities should you select the first process? the second process?
d.Operations and Engineering have found a way to reduce the cost of the second process,such that the fixed costs for this process decrease from $400,000 to $300,000 annually.All other costs remain the same (1st process fixed = $50,000 / year,1st process variable = $700 / unit,2nd process variable = $200 / unit).What is the new break even quantity between the two processes?
e.Does this change the process selection for the annual sales volume of 600 units? If so,for what range of annual production quantities should you select the first process and the second process?
(Essay)
4.9/5 (28)
An eighty percent learning curve means that for each doubling of output,the time required to complete the last task is ________ percent less than before.
(Essay)
4.8/5 (34)
Create a flowchart that displays the proper sequential use of the major graphical tools in Chapter 4,"Process Analysis." Include a note next to each tool that explains how the output of one tool is used as the input for the following tool.
(Essay)
4.8/5 (29)
A group of people,who are knowledgeable about the process and its disconnects,meets to propose ideas for change in a rapid-fire manner.Such a session is called a brainstorming session.
(True/False)
4.8/5 (45)
Active customer contact and personalized attention can lower cost to the customer by:
(Multiple Choice)
4.8/5 (28)
Higher volume processes are more likely to be encountered in the back office.
(True/False)
5.0/5 (43)
An examination of strategic issues such as possible gaps between a process's competitive priorities and current competitive capabilities falls in the:
(Multiple Choice)
4.8/5 (37)
Filters
- Essay(0)
- Multiple Choice(0)
- Short Answer(0)
- True False(0)
- Matching(0)