Exam 15: Statistical Quality Control
Exam 1: Introduction to Quantitative Analysis96 Questions
Exam 2: Probability Concepts and Applications155 Questions
Exam 3: Decision Analysis128 Questions
Exam 4: Regression Models129 Questions
Exam 5: Forecasting138 Questions
Exam 6: Inventory Control Models147 Questions
Exam 7: Linear Programming Models: Graphical and Computer Methods141 Questions
Exam 8: Linear Programming Applications89 Questions
Exam 9: Transportation, Assignment, and Network Models112 Questions
Exam 10: Integer Programming, Goal Programming, and Nonlinear Programming86 Questions
Exam 11: Project Management142 Questions
Exam 12: Waiting Lines and Queuing Theory Models127 Questions
Exam 13: Simulation Modeling94 Questions
Exam 14: Markov Analysis103 Questions
Exam 15: Statistical Quality Control96 Questions
Exam 16: Analytic Hierarchy Process66 Questions
Exam 17: Dynamic Programming86 Questions
Exam 18: Decision Theory and the Normal Distribution62 Questions
Exam 19: Game Theory59 Questions
Exam 20: Mathematical Tools: Determinants and Matrices104 Questions
Exam 21: Calculus-Based Optimization39 Questions
Exam 22: Linear Programming: The Simplex Method98 Questions
Exam 23: Transportation, Assignment, and Network Algorithms120 Questions
Select questions type
If we are attempting to control the diameter of bowling balls, we will find a p-chart to be quite helpful.
(True/False)
4.9/5  (37)
(37)
Control charts that are used to monitor processes that are measured in continuous units are classified as which of the following?
(Multiple Choice)
4.8/5 (47)
Table 15-1
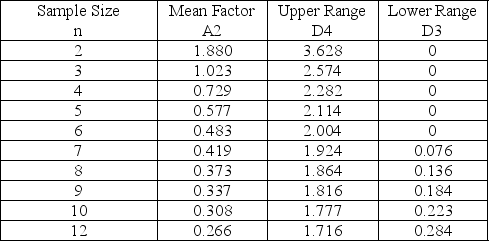 -Refer to Table 15-1.Bags of tea are sampled to ensure proper weight.The overall average for the samples is 8 ounces.Each sample contains 10 bags.The average range is 0.1 ounces.What is the lower limit of the sample averages chart?
(Multiple Choice)
4.8/5 (36)
A p-chart has been developed for a particular item.In the past, 4% of such items have been found to be defective.If a sample of 100 is taken, and 9 of these are found to be defective, should the process be considered out of control based on 99.7% control limits? Explain.
(Essay)
5.0/5 (44)
A company has been receiving complaints about the attitude of some sales clerks.Over a 10-day period, the total number of complaints was 250.The company wishes to develop a control chart for the number of complaints.What would the upper control limit on the number of complaints per day be for a 2 sigma (95.5%)control chart?
(Multiple Choice)
4.8/5 (43)
A professor gives a series of twenty quizzes in his operations planning and control class just to keep his students on their toes.Each quiz consists of one hundred true-false questions and the results for one student are shown in the table.Construct an appropriate control chart for this situation.Is the student in control?
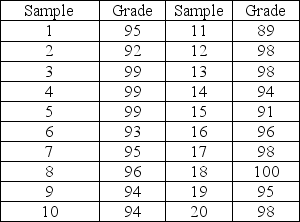
(Essay)
4.9/5 (28)
All that is required to develop limits for a C-chart is knowledge of the average count of defects.
(True/False)
4.9/5 (42)
Variations that need not occur in production processes are referred to as
(Multiple Choice)
4.9/5 (41)
A plant manager is concerned with the variability of beer being filled in 12 oz.cans.The most appropriate control chart would be which of the following?
(Multiple Choice)
4.9/5 (41)
The central limit theorem states that the distribution of x-bars will tend to follow a normal distribution as long as the population they are drawn from is normally distributed.
(True/False)
4.9/5 (37)
A company believes a process monitored by an x-bar chart to be in control.When the most recent control point exceeded the UCL value by 20%, the company should
(Multiple Choice)
4.9/5 (34)
Assignable variations in a process are also called natural variations.
(True/False)
4.7/5 (41)
Bags of pretzels are sampled to ensure proper weight.The overall average for the samples is 9 ounces.Each sample contains 25 bags.The standard deviation is estimated to be 3 ounces.The upper control chart limit (for 99.7% confidence)for the average would be ________ ounces.
(Multiple Choice)
4.9/5 (37)
Filters
- Essay(0)
- Multiple Choice(0)
- Short Answer(0)
- True False(0)
- Matching(0)