Exam 15: Statistical Quality Control
Exam 1: Introduction to Quantitative Analysis96 Questions
Exam 2: Probability Concepts and Applications155 Questions
Exam 3: Decision Analysis128 Questions
Exam 4: Regression Models129 Questions
Exam 5: Forecasting138 Questions
Exam 6: Inventory Control Models147 Questions
Exam 7: Linear Programming Models: Graphical and Computer Methods141 Questions
Exam 8: Linear Programming Applications89 Questions
Exam 9: Transportation, Assignment, and Network Models112 Questions
Exam 10: Integer Programming, Goal Programming, and Nonlinear Programming86 Questions
Exam 11: Project Management142 Questions
Exam 12: Waiting Lines and Queuing Theory Models127 Questions
Exam 13: Simulation Modeling94 Questions
Exam 14: Markov Analysis103 Questions
Exam 15: Statistical Quality Control96 Questions
Exam 16: Analytic Hierarchy Process66 Questions
Exam 17: Dynamic Programming86 Questions
Exam 18: Decision Theory and the Normal Distribution62 Questions
Exam 19: Game Theory59 Questions
Exam 20: Mathematical Tools: Determinants and Matrices104 Questions
Exam 21: Calculus-Based Optimization39 Questions
Exam 22: Linear Programming: The Simplex Method98 Questions
Exam 23: Transportation, Assignment, and Network Algorithms120 Questions
Select questions type
Table 15-1
 -Refer to Table 15-1.Bags of chocolate candy are sampled to ensure proper weight.The overall average for the samples is 36 ounces.Each sample contains twelve bags.The average range is 1.3 ounces.The upper control chart limit for the sample averages would be
(Multiple Choice)
4.9/5  (33)
(33)
Table 15-1
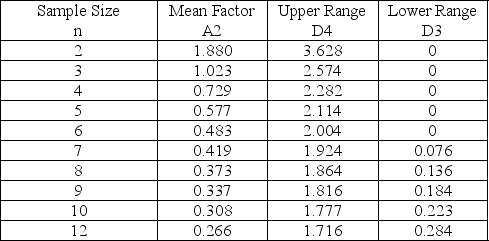 -Use the data shown below and the information in Table 15-1 to develop an upper control limit for a control chart that monitors central tendency.What is the upper control limit?
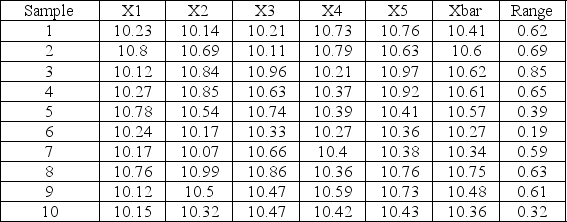
(Multiple Choice)
4.9/5 (29)
The area from two standard deviations above to two standard deviations below the mean of a normal distribution will contain 99.7% of all of the area under the curve.
(True/False)
4.9/5 (37)
Which of the following control charts is/are for variables?
(Multiple Choice)
4.8/5 (36)
A company has been receiving complaints about the attitude of some sales clerks.Over a 10-day period, the total number of complaints was 250.The company wishes to develop a control chart for the number of complaints.What would the lower control limit on the number of complaints per day be for a 2 sigma (95.5%)control chart?
(Multiple Choice)
4.9/5 (46)
The inspection of cans of juice involves sampling some cans and weighing them.The overall average for the samples is 39 ounces.Each sample contains 36 cans.The standard deviation is estimated to be 2 ounces.The 99.7% lower control chart limit for the average would be
(Multiple Choice)
4.9/5 (47)
Table 15-1
-Refer to Table 15-1.Bags of chocolate candy are sampled to ensure proper weight.The overall average for the samples is 36 ounces.Each sample contains eight bags.The average range is 1.3 ounces.The lower control chart limit for the sample averages would be
(Multiple Choice)
4.9/5 (38)
A p-chart has been developed for a particular item.In the past, 4% of such items have been found to be defective.If a sample of 100 is taken, and 9 of these are found to be defective, should the process be considered out of control based on 95.5% control limits? Explain.
(Essay)
4.7/5 (38)
A p-chart is based on which of the following probability distributions?
(Multiple Choice)
4.8/5 (34)
A run of four consecutive points above the center line is a sufficient reason to stop the process and investigate for cause.
(True/False)
4.7/5 (36)
Table 15-1
-Refer to Table 15-1.To guarantee that cans of soda are properly filled, some cans are sampled and the amounts measured.The overall average for the samples is 12 ounces.Each sample contains 10 cans.The average range is 0.4 ounces.The lower control chart limit for the sample averages would be
(Multiple Choice)
4.9/5 (34)
A c-chart would be appropriate to monitor the number of weld defects on the steel plates of a ship's hull.
(True/False)
4.9/5 (26)
Filters
- Essay(0)
- Multiple Choice(0)
- Short Answer(0)
- True False(0)
- Matching(0)