Exam 15: Statistical Quality Control
Exam 1: Introduction to Quantitative Analysis96 Questions
Exam 2: Probability Concepts and Applications155 Questions
Exam 3: Decision Analysis128 Questions
Exam 4: Regression Models129 Questions
Exam 5: Forecasting138 Questions
Exam 6: Inventory Control Models147 Questions
Exam 7: Linear Programming Models: Graphical and Computer Methods141 Questions
Exam 8: Linear Programming Applications89 Questions
Exam 9: Transportation, Assignment, and Network Models112 Questions
Exam 10: Integer Programming, Goal Programming, and Nonlinear Programming86 Questions
Exam 11: Project Management142 Questions
Exam 12: Waiting Lines and Queuing Theory Models127 Questions
Exam 13: Simulation Modeling94 Questions
Exam 14: Markov Analysis103 Questions
Exam 15: Statistical Quality Control96 Questions
Exam 16: Analytic Hierarchy Process66 Questions
Exam 17: Dynamic Programming86 Questions
Exam 18: Decision Theory and the Normal Distribution62 Questions
Exam 19: Game Theory59 Questions
Exam 20: Mathematical Tools: Determinants and Matrices104 Questions
Exam 21: Calculus-Based Optimization39 Questions
Exam 22: Linear Programming: The Simplex Method98 Questions
Exam 23: Transportation, Assignment, and Network Algorithms120 Questions
Select questions type
Defects in computer hard-drives will usually render the entire computer worthless.For a particular model, the percent defective in the past has been 1%.If a sample size of 400 is taken, what would the 95.5% lower control chart limit be?
(Multiple Choice)
4.7/5  (36)
(36)
A company has been receiving complaints about the attitude of some sales clerks.Over a 10-day period, the total number of complaints was 360.The company wishes to develop a control chart for the number of complaints.What would the upper control limit on the number of complaints per day be for a 2 sigma (95.5%)control chart?
(Multiple Choice)
4.8/5 (28)
An x-bar chart would be appropriate to monitor the number of defects in a production lot.
(True/False)
4.9/5 (42)
P-charts and c-charts are examples of control charts for variables.
(True/False)
4.9/5 (40)
The central limit theorem provides the statistical foundation for control charts.
(True/False)
4.9/5 (38)
Which of these patterns on a control chart would require a worker to stop the process and investigate for an assignable cause?
(Multiple Choice)
4.8/5 (39)
Table 15-1
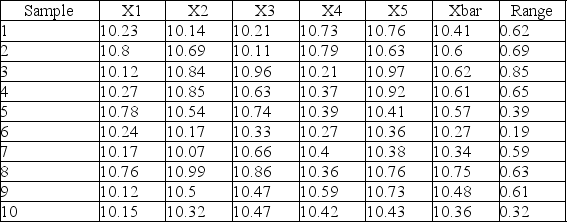
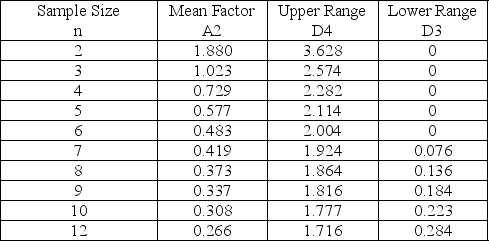 -Use the data shown below and the information in Table 15-1 to develop a control chart that monitors central tendency.Use your chart to make an assessment - is the process in control?
(Essay)
4.8/5 (34)
A company is producing cylindrical blocks for a children's toy.The average diameter of a block is 3.5 inches.Sixteen blocks are inspected and the diameters are measured.The standard deviation is estimated to be 0.02 inches.What are the 99.7% upper and lower control limits for the x-bar chart?
(Short Answer)
4.7/5 (43)
Technically, to achieve Six Sigma quality, there would have to be fewer than ________ defects per million opportunities.
(Multiple Choice)
4.7/5 (36)
A coffee dispenser is supposed to dispense coffee into an 8 o.z.cup.The average amount of coffee filled into the cup must be below 7.9.This is best monitored by which of the following control charts?
(Multiple Choice)
4.8/5 (38)
If we are tracking quality of performance for a class of students, we should plot the individual grades on an x-bar chart, and the pass/fail result on a p-chart.
(True/False)
4.8/5 (36)
A computer software manufacturer has a toll-free telephone number that customers may use if they have problems or questions about the software.In the past, the company has averaged four calls per hour on a particular product.If a 95.5% c-chart is developed for this, what would the limits be?
(Short Answer)
4.7/5 (36)
Which of the following control charts is/are for attributes?
(Multiple Choice)
4.9/5 (40)
Samaje studied his control chart and noticed it had been built with repeated samples of five units and three sigma limits that were UCL = 51.71 and LCL = 38.29.What is the process standard deviation?
(Multiple Choice)
4.9/5 (34)
Which of these patterns on a control chart would require a worker to stop the process and investigate for an assignable cause?
(Multiple Choice)
4.8/5 (36)
Defects in the finish of new, custom automobiles usually require the whole body to be repainted.In one "custom" shop, the percentage of defective finishes has been 2 percent.If a sample size of 10 is taken, what should the 99.7 percent upper control limit be?
(Multiple Choice)
4.8/5 (37)
Statistical process control uses regression and other forecasting tools to help control processes.
(True/False)
4.9/5 (40)
Table 15-1
-Use the data shown below and the information in Table 15-1 to develop a control chart that monitors consistency.Use your chart to make an assessment - is the process in control?

(Essay)
4.8/5 (35)
Filters
- Essay(0)
- Multiple Choice(0)
- Short Answer(0)
- True False(0)
- Matching(0)