Exam 14: Markov Analysis
Exam 1: Introduction to Quantitative Analysis96 Questions
Exam 2: Probability Concepts and Applications155 Questions
Exam 3: Decision Analysis128 Questions
Exam 4: Regression Models129 Questions
Exam 5: Forecasting138 Questions
Exam 6: Inventory Control Models147 Questions
Exam 7: Linear Programming Models: Graphical and Computer Methods141 Questions
Exam 8: Linear Programming Applications89 Questions
Exam 9: Transportation, Assignment, and Network Models112 Questions
Exam 10: Integer Programming, Goal Programming, and Nonlinear Programming86 Questions
Exam 11: Project Management142 Questions
Exam 12: Waiting Lines and Queuing Theory Models127 Questions
Exam 13: Simulation Modeling94 Questions
Exam 14: Markov Analysis103 Questions
Exam 15: Statistical Quality Control96 Questions
Exam 16: Analytic Hierarchy Process66 Questions
Exam 17: Dynamic Programming86 Questions
Exam 18: Decision Theory and the Normal Distribution62 Questions
Exam 19: Game Theory59 Questions
Exam 20: Mathematical Tools: Determinants and Matrices104 Questions
Exam 21: Calculus-Based Optimization39 Questions
Exam 22: Linear Programming: The Simplex Method98 Questions
Exam 23: Transportation, Assignment, and Network Algorithms120 Questions
Select questions type
Table 14-2
The following data consists of a matrix of transition probabilities (P)of three competing retailers, the initial market share π(0).Assume that each state represents a retailer (Retailer 1, Retailer 2, Retailer 3, respectively)and the transition probabilities represent changes from one month to the next.
P =  π(0)= (0.3, 0.6, 0.1)
-Using the data given in Table 14-2, find the market shares for the three retailers in month 1.
π(0)= (0.3, 0.6, 0.1)
-Using the data given in Table 14-2, find the market shares for the three retailers in month 1.
(Multiple Choice)
4.9/5  (38)
(38)
In Markov analysis, to find the vector of state probabilities for any period
(Multiple Choice)
4.8/5 (32)
Given the following matrix of transition probabilities, find the equilibrium states. 
(Short Answer)
4.8/5 (39)
Describe the concept of "mutually exclusive" in the context of Markov analysis.
(Essay)
4.8/5 (31)
Table 14-1
The following data consists of a matrix of transition probabilities (P)of three competing companies, and the initial market share π(0).Assume that each state represents a company (Company 1, Company 2, Company 3, respectively)and the transition probabilities represent changes from one month to the next.
P =  π(0)= (0.3, 0.6, 0.1)
-Using the data in Table 14-1, and assuming that the transition probabilities do not change, in the long run what market share would Company 2 expect to reach? (Rounded to two decimal places.)
π(0)= (0.3, 0.6, 0.1)
-Using the data in Table 14-1, and assuming that the transition probabilities do not change, in the long run what market share would Company 2 expect to reach? (Rounded to two decimal places.)
(Multiple Choice)
4.9/5 (33)
Creating the fundamental matrix requires a partition of the matrix of transition.
(True/False)
4.8/5 (33)
Table 14-3
The following data consists of a matrix of transition probabilities (P)of three office locations (A,B,C)within a large company and how employees shift from one location to the other from year to year.The company CEO would like to understand the movement of employees over time and the long-run proportion of employees in each location.Assume that there is always a total of 3000 employees.
A B C
P = 
 π(0)= [1000, 1000, 1000)
-Using the data given in Table 14-3, how many employees do we expect in location B one year from now?
π(0)= [1000, 1000, 1000)
-Using the data given in Table 14-3, how many employees do we expect in location B one year from now?
(Multiple Choice)
4.8/5 (36)
The copy machine in an office is very unreliable.If it was working yesterday, there is an 80% chance it will work today.If it was not working yesterday, there is a 10% chance it will work today.If it is not working today, what is the probability that it will be working 2 days from now?
(Multiple Choice)
4.8/5 (34)
The weather is becoming important to you since you would like to go on a picnic today.If it was sunny yesterday, there is a 70% chance it will be sunny today.If it was raining yesterday, there is a 30% chance it will be sunny today.If the probability that it was raining yesterday is 0.25, what is the probability that it will rain today?
(Multiple Choice)
4.7/5 (37)
If you are in an absorbing state, you cannot go to another state in the future.
(True/False)
4.9/5 (39)
An equilibrium condition exists if the state probabilities for a future period are the same as the state probabilities for a previous period.
(True/False)
4.9/5 (35)
Over any given month, Hammond Market loses 10% of its customers to Otro Plaza and 20% to Tres Place.Otro Plaza loses 5% to Hammond and 10% to Tres Place.Tres Place loses 5% of its customers to each of the two competitors.At the present time, Hammond Market has 40% of the market, while the others have 30% each.
(a)Next month, what will the market shares be for the three firms?
(b)In two months, what will the market shares be for the three firms?
(Essay)
4.9/5 (31)
A Markov process could be used as a model of how a disease progresses from one set of symptoms to another.
(True/False)
4.9/5 (40)
Table 14-2
The following data consists of a matrix of transition probabilities (P)of three competing retailers, the initial market share π(0).Assume that each state represents a retailer (Retailer 1, Retailer 2, Retailer 3, respectively)and the transition probabilities represent changes from one month to the next.
P = π(0)= (0.3, 0.6, 0.1)
-Using the data given in Table 14-2, find the market shares for the three retailers in month 2.
(Multiple Choice)
4.8/5 (33)
The following data consists of a matrix of transition probabilities (P)of Accounting, Economics, Finance, and Management and the count of students in each major.Assume that each state represents a major and the transition probabilities represent changes from one major to the next after taking the introductory class in each discipline.It takes two semesters for students to finish taking all four introductory courses.
P =  π(0)= (600, 50, 200, 250)
Determine the number of majors in each discipline at the end of two semesters.
π(0)= (600, 50, 200, 250)
Determine the number of majors in each discipline at the end of two semesters.
(Essay)
4.8/5 (36)
When absorbing states exist, the fundamental matrix is used to compute equilibrium conditions.
(True/False)
4.9/5 (32)
Table 14-6
The following data consists of a matrix of transition probabilities (P)of four majors in the College of Business, and the initial proportion of students in each major π(0).Assume that each state represents a major and the transition probabilities represent changes from one major to the next after taking the introductory class in each discipline.
P =
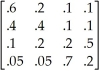 π(0)= (.4, .3, .2, .1)
-Using the data in Table 14-6, what proportion of students will major in Major 2?
π(0)= (.4, .3, .2, .1)
-Using the data in Table 14-6, what proportion of students will major in Major 2?
(Multiple Choice)
4.9/5 (27)
Filters
- Essay(0)
- Multiple Choice(0)
- Short Answer(0)
- True False(0)
- Matching(0)