Exam 14: Markov Analysis
Exam 1: Introduction to Quantitative Analysis96 Questions
Exam 2: Probability Concepts and Applications155 Questions
Exam 3: Decision Analysis128 Questions
Exam 4: Regression Models129 Questions
Exam 5: Forecasting138 Questions
Exam 6: Inventory Control Models147 Questions
Exam 7: Linear Programming Models: Graphical and Computer Methods141 Questions
Exam 8: Linear Programming Applications89 Questions
Exam 9: Transportation, Assignment, and Network Models112 Questions
Exam 10: Integer Programming, Goal Programming, and Nonlinear Programming86 Questions
Exam 11: Project Management142 Questions
Exam 12: Waiting Lines and Queuing Theory Models127 Questions
Exam 13: Simulation Modeling94 Questions
Exam 14: Markov Analysis103 Questions
Exam 15: Statistical Quality Control96 Questions
Exam 16: Analytic Hierarchy Process66 Questions
Exam 17: Dynamic Programming86 Questions
Exam 18: Decision Theory and the Normal Distribution62 Questions
Exam 19: Game Theory59 Questions
Exam 20: Mathematical Tools: Determinants and Matrices104 Questions
Exam 21: Calculus-Based Optimization39 Questions
Exam 22: Linear Programming: The Simplex Method98 Questions
Exam 23: Transportation, Assignment, and Network Algorithms120 Questions
Select questions type
The following data consists of a matrix of transition probabilities (P)of Accounting, Economics, Finance, and Management and the count of students in each major.Assume that each state represents a major and the transition probabilities represent changes from one major to the next after taking the introductory class in each discipline.
P =  π(0)= (600, 50, 200, 250)
Determine the number of majors in each discipline once steady state has been achieved.
π(0)= (600, 50, 200, 250)
Determine the number of majors in each discipline once steady state has been achieved.
(Essay)
4.9/5  (38)
(38)
Markov analysis is a technique that deals with the probabilities of future occurrences by analyzing currently known probabilities.
(True/False)
4.7/5 (32)
The fax machine in an office is very unreliable.If it was working yesterday, there is an 90% chance it will work today.If it was not working yesterday, there is a 5% chance it will work today.
(a)What is the probability that it is not working today, if it was not working yesterday?
(b)If it was working yesterday, what is the probability that it is working today?
(Short Answer)
4.8/5 (42)
Table 14-6
The following data consists of a matrix of transition probabilities (P)of four majors in the College of Business, and the initial proportion of students in each major π(0).Assume that each state represents a major and the transition probabilities represent changes from one major to the next after taking the introductory class in each discipline.
P =
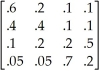 π(0)= (.4, .3, .2, .1)
-Using the data in Table 14-6, determine Major 3's estimated popularity after students have taken the first two introductory courses.
π(0)= (.4, .3, .2, .1)
-Using the data in Table 14-6, determine Major 3's estimated popularity after students have taken the first two introductory courses.
(Multiple Choice)
4.9/5 (29)
Equilibrium state probabilities may be estimated by using Markov analysis for a large number of periods.
(True/False)
4.9/5 (38)
Table 14-4
Cuthbert Wylinghauser is a scheduler of transportation for the state of Delirium.This state contains three cities: Chaos (C1), Frenzy (C2), and Tremor (C3).A transition matrix, indicating the probability that a resident in one city will travel to another, is given below.Cuthbert's job is to schedule the required number of seats, one to each person making the trip (transition), on a daily basis.
C F T
Transition matrix:
![Table 14-4 Cuthbert Wylinghauser is a scheduler of transportation for the state of Delirium.This state contains three cities: Chaos (C1), Frenzy (C2), and Tremor (C3).A transition matrix, indicating the probability that a resident in one city will travel to another, is given below.Cuthbert's job is to schedule the required number of seats, one to each person making the trip (transition), on a daily basis. C F T Transition matrix: π(0)= [100, 100, 100] -Using the data given in Table 14-4, how many seats should Cuthbert schedule for travel from Chaos to Frenzy for tomorrow?](https://storage.examlex.com/TB5481/11eab9ea_e5cc_5265_b53a_594c8c547055_TB5481_11_TB5481_11_TB5481_11_TB5481_11.jpg)
![Table 14-4 Cuthbert Wylinghauser is a scheduler of transportation for the state of Delirium.This state contains three cities: Chaos (C1), Frenzy (C2), and Tremor (C3).A transition matrix, indicating the probability that a resident in one city will travel to another, is given below.Cuthbert's job is to schedule the required number of seats, one to each person making the trip (transition), on a daily basis. C F T Transition matrix: π(0)= [100, 100, 100] -Using the data given in Table 14-4, how many seats should Cuthbert schedule for travel from Chaos to Frenzy for tomorrow?](https://storage.examlex.com/TB5481/11eab9ea_e5cc_5266_b53a_3ba57bc18d64_TB5481_11_TB5481_11_TB5481_11_TB5481_11.jpg) π(0)= [100, 100, 100]
-Using the data given in Table 14-4, how many seats should Cuthbert schedule for travel from Chaos to Frenzy for tomorrow?
π(0)= [100, 100, 100]
-Using the data given in Table 14-4, how many seats should Cuthbert schedule for travel from Chaos to Frenzy for tomorrow?
(Multiple Choice)
4.9/5 (35)
The following data consists of a matrix of transition probabilities (P)of three potential diseases, and the initial incidence of each disease π(0).Assume that each state represents a disease (Disease 1, Disease 2, Disease 3, respectively)and the transition probabilities represent changes from one checkup to the next.What is the incidence of the three diseases in the next period?
P =  π(0)= (.2, .3, .5)
(Essay)
4.9/5 (32)
The matrix that is needed to compute equilibrium conditions when absorbing states are involved is called a(n)
(Multiple Choice)
4.9/5 (37)
Given the following matrix of transition probabilities, write three equations that, when solved, will give the equilibrium state values.
P = 
(Essay)
4.7/5 (34)
Table 14-1
The following data consists of a matrix of transition probabilities (P)of three competing companies, and the initial market share π(0).Assume that each state represents a company (Company 1, Company 2, Company 3, respectively)and the transition probabilities represent changes from one month to the next.
P =  π(0)= (0.3, 0.6, 0.1)
-Using the data in Table 14-1, determine Company 2's estimated market share in the next period.
π(0)= (0.3, 0.6, 0.1)
-Using the data in Table 14-1, determine Company 2's estimated market share in the next period.
(Multiple Choice)
4.8/5 (46)
A collection of all state probabilities for a given system at any given period of time is called the
(Multiple Choice)
4.8/5 (35)
The weather is becoming important to you since you would like to go on a picnic today.If it was sunny yesterday, there is a 70% chance it will be sunny today.If it was raining yesterday, there is a 30% chance it will be sunny today.What is the probability it will be rainy today, if it was sunny yesterday?
(Multiple Choice)
4.9/5 (36)
Table 14-3
The following data consists of a matrix of transition probabilities (P)of three office locations (A,B,C)within a large company and how employees shift from one location to the other from year to year.The company CEO would like to understand the movement of employees over time and the long-run proportion of employees in each location.Assume that there is always a total of 3000 employees.
A B C
P = 
 π(0)= [1000, 1000, 1000)
-Using the data given in Table 14-3, what is the long run number of employees expected in location C?
π(0)= [1000, 1000, 1000)
-Using the data given in Table 14-3, what is the long run number of employees expected in location C?
(Multiple Choice)
4.9/5 (38)
In Markov analysis it is assumed that states are both mutually exclusive and collectively exhaustive.
(True/False)
4.8/5 (38)
Table 14-4
Cuthbert Wylinghauser is a scheduler of transportation for the state of Delirium.This state contains three cities: Chaos (C1), Frenzy (C2), and Tremor (C3).A transition matrix, indicating the probability that a resident in one city will travel to another, is given below.Cuthbert's job is to schedule the required number of seats, one to each person making the trip (transition), on a daily basis.
C F T
Transition matrix:
π(0)= [100, 100, 100]
-Using the data given in Table 14-4, how many people can we expect to find in each city tomorrow evening?
(Multiple Choice)
4.9/5 (28)
Table 14-3
The following data consists of a matrix of transition probabilities (P)of three office locations (A,B,C)within a large company and how employees shift from one location to the other from year to year.The company CEO would like to understand the movement of employees over time and the long-run proportion of employees in each location.Assume that there is always a total of 3000 employees.
A B C
P = π(0)= [1000, 1000, 1000)
-Using the data given in Table 14-3, how many employees do we expect in location B two years from now?
(Multiple Choice)
5.0/5 (36)
The vector of state probabilities gives the probability of being in particular states at a particular point in time.
(True/False)
5.0/5 (25)
Given the following vector of state probabilities and the accompanying matrix of transition probabilities, find the next period vector of state probabilities.
(0.4 0.4 0.2) 
(Short Answer)
4.9/5 (39)
Table 14-6
The following data consists of a matrix of transition probabilities (P)of four majors in the College of Business, and the initial proportion of students in each major π(0).Assume that each state represents a major and the transition probabilities represent changes from one major to the next after taking the introductory class in each discipline.
P =
π(0)= (.4, .3, .2, .1)
-Using the data in Table 14-6, determine Major 2's estimated popularity after students have taken the first introductory course.
(Multiple Choice)
4.8/5 (37)
Table 14-5
The following data consists of a matrix of transition probabilities (P)of three potential diseases, and the initial incidence of each disease π(0).Assume that each state represents a disease (Disease 1, Disease 2, Disease 3, respectively)and the transition probabilities represent changes from one checkup to the next.
P =
 π(0)= (.3, .3, .4)
-Using the data in Table 14-5, determine Disease 1's estimated incidence in the next period.
π(0)= (.3, .3, .4)
-Using the data in Table 14-5, determine Disease 1's estimated incidence in the next period.
(Multiple Choice)
4.7/5 (32)
Filters
- Essay(0)
- Multiple Choice(0)
- Short Answer(0)
- True False(0)
- Matching(0)