Exam 18: Statistical Applications in Quality Management
Exam 1: Defining and Collecting Data189 Questions
Exam 3: Numerical Descriptive Measures184 Questions
Exam 4: Basic Probability156 Questions
Exam 5: Discrete Probability Distributions218 Questions
Exam 6: The Normal Distribution and Other Continuous Distributions189 Questions
Exam 7: Sampling Distributions127 Questions
Exam 8: Confidence Interval Estimation196 Questions
Exam 9: Fundamentals of Hypothesis Testing: One-Sample Tests170 Questions
Exam 10: Two-Sample Tests210 Questions
Exam 11: Analysis of Variance130 Questions
Exam 12: Chi-Square Tests and Nonparametric Tests175 Questions
Exam 13: Simple Linear Regression213 Questions
Exam 14: Introduction to Multiple Regression337 Questions
Exam 15: Multiple Regression Model Building96 Questions
Exam 16: Time-Series Forecasting165 Questions
Exam 17: A Roadmap for Analyzing Data303 Questions
Exam 18: Statistical Applications in Quality Management130 Questions
Exam 19: Decision Making126 Questions
Exam 20: Index Numbers44 Questions
Exam 21: Chi-Square Tests for the Variance or Standard Deviation11 Questions
Exam 22: Mcnemar Test for the Difference Between Two Proportions Related Samples15 Questions
Exam 25: The Analysis of Means Anom2 Questions
Exam 23: The Analysis of Proportions Anop3 Questions
Exam 24: The Randomized Block Design85 Questions
Exam 26: The Power of a Test41 Questions
Exam 27: Estimation and Sample Size Determination for Finite Populations13 Questions
Exam 28: Application of Confidence Interval Estimation in Auditing13 Questions
Exam 29: Sampling From Finite Populations20 Questions
Exam 30: The Normal Approximation to the Binomial Distribution27 Questions
Exam 31: Counting Rules14 Questions
Exam 32: Lets Get Started Big Things to Learn First33 Questions
Select questions type
TABLE 18-4
A factory supervisor is concerned that the time it takes workers to complete an important production task (measured in seconds)is too erratic and adversely affects expected profits.The supervisor proceeds by randomly sampling 5 individuals per hour for a period of 10 hours.The sample mean and range for each hour are listed below. 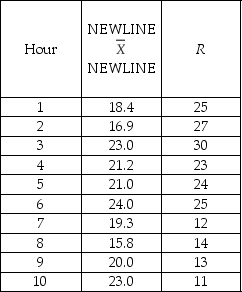 She also decides that lower and upper specification limit for the critical-to-quality variable should be 10 and 30 seconds,respectively.
-True or False: Common causes of variation represent variation due to the inherent variability in the system.
She also decides that lower and upper specification limit for the critical-to-quality variable should be 10 and 30 seconds,respectively.
-True or False: Common causes of variation represent variation due to the inherent variability in the system.
(True/False)
4.7/5  (27)
(27)
TABLE 18-10
Below is the number of defective items from a production line over twenty consecutive morning shifts. 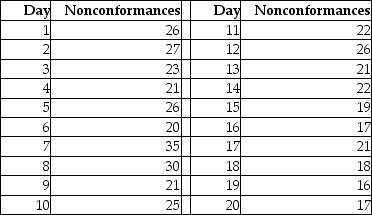 -Referring to Table 18-10,construct a c chart for the number of defective items.
(Essay)
4.7/5 (31)
TABLE 18-9
The manufacturer of canned food constructed control charts and analyzed several quality characteristics.One characteristic of interest is the weight of the filled cans.The lower specification limit for weight is 2.95 pounds.The table below provides the range and mean of the weights of five cans tested every fifteen minutes during a day's production. 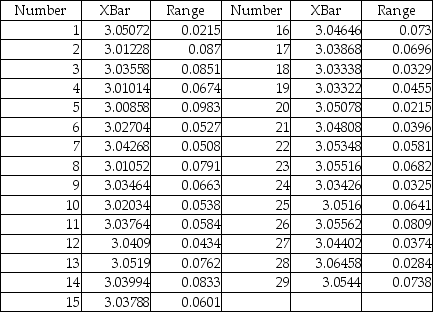 -Referring to Table 18-9,an R chart is to be constructed for the weight.The center line of this R chart is located at ________.
(Short Answer)
4.9/5 (35)
TABLE 18-8
Recently,a university switched to a new type of computer-based registration.The registrar is concerned with the amount of time students are spending on the computer registering under the new system.She decides to randomly select 8 students on each of the 12 days of the registration and determine the time each spends on the computer registering.The range,mean,and standard deviation of the times required to register are in the table that follows. 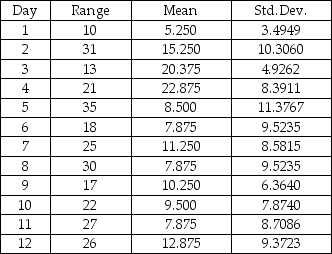 -Referring to Table 18-8,an R chart is to be constructed for the time required to register.The lower control limit for this data set is ________.
(Short Answer)
4.7/5 (33)
TABLE 18-7
A supplier of silicone sheets for producers of computer chips wants to evaluate her manufacturing process.She takes sample sizes of 5 from each day's output and counts the number of blemishes on each silicone sheet.The results from 20 days of such evaluations are presented below.
Sheet
Day 1 2 3 4 5 Mean Range
1 8 10 14 6 5 8.6 9
2 8 13 6 6 10 8.6 7
3 10 12 7 7 9 9.0 5
4 5 9 12 7 10 8.6 7
5 8 3 8 9 10 7.6 7
6 9 7 9 6 9 8.0 3
7 10 10 5 7 6 7.6 5
8 10 9 10 6 5 8.0 5
9 6 10 6 9 9 8.0 4
10 6 9 8 6 8 7.4 3
11 8 5 6 10 10 7.8 5
12 6 4 7 7 12 7.2 8
13 7 5 7 6 9 6.8 4
14 5 8 8 7 6 6.8 3
15 7 12 10 6 10 9.0 6
16 7 11 4 7 8 7.4 7
17 8 4 5 4 7 5.6 4
18 11 4 11 11 10 9.4 7
19 6 10 6 10 10 8.4 4
20 6 12 12 6 8 8.8 6
She also decides that the upper specification limit is 10 blemishes.
-Referring to Table 18-7,an  chart is to be used for the number of blemishes.The center line of this chart is located at ________.
(Short Answer)
4.9/5 (45)
TABLE 18-7
A supplier of silicone sheets for producers of computer chips wants to evaluate her manufacturing process.She takes sample sizes of 5 from each day's output and counts the number of blemishes on each silicone sheet.The results from 20 days of such evaluations are presented below.
Sheet
Day 1 2 3 4 5 Mean Range
1 8 10 14 6 5 8.6 9
2 8 13 6 6 10 8.6 7
3 10 12 7 7 9 9.0 5
4 5 9 12 7 10 8.6 7
5 8 3 8 9 10 7.6 7
6 9 7 9 6 9 8.0 3
7 10 10 5 7 6 7.6 5
8 10 9 10 6 5 8.0 5
9 6 10 6 9 9 8.0 4
10 6 9 8 6 8 7.4 3
11 8 5 6 10 10 7.8 5
12 6 4 7 7 12 7.2 8
13 7 5 7 6 9 6.8 4
14 5 8 8 7 6 6.8 3
15 7 12 10 6 10 9.0 6
16 7 11 4 7 8 7.4 7
17 8 4 5 4 7 5.6 4
18 11 4 11 11 10 9.4 7
19 6 10 6 10 10 8.4 4
20 6 12 12 6 8 8.8 6
She also decides that the upper specification limit is 10 blemishes.
-Referring to Table 18-7,what is the value of d2 factor?
(Short Answer)
4.9/5 (40)
TABLE 18-4
A factory supervisor is concerned that the time it takes workers to complete an important production task (measured in seconds)is too erratic and adversely affects expected profits.The supervisor proceeds by randomly sampling 5 individuals per hour for a period of 10 hours.The sample mean and range for each hour are listed below. She also decides that lower and upper specification limit for the critical-to-quality variable should be 10 and 30 seconds,respectively.
-Referring to Table 18-4,what is the value of the Cpk index?
(Short Answer)
4.8/5 (40)
TABLE 18-3
A quality control analyst for a light bulb manufacturer is concerned that the time it takes to produce a batch of light bulbs is too erratic.Accordingly,the analyst randomly surveys 10 production periods each day for 14 days and records the sample mean and range for each day. 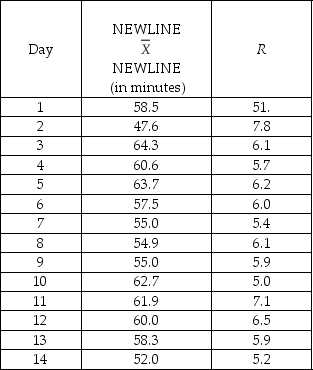 -Referring to Table 18-3,suppose the analyst constructs an
  chart to see if the production process is in-control.What is the lower control limit (LCL)for this chart?
(Multiple Choice)
4.9/5 (36)
TABLE 18-8
Recently,a university switched to a new type of computer-based registration.The registrar is concerned with the amount of time students are spending on the computer registering under the new system.She decides to randomly select 8 students on each of the 12 days of the registration and determine the time each spends on the computer registering.The range,mean,and standard deviation of the times required to register are in the table that follows.
-Referring to Table 18-8,an R chart is to be constructed for the time required to register.The upper control limit for this data set is ________.
(Short Answer)
4.7/5 (37)
Which of the following is not part of the Shewhart-Deming cycle?
(Multiple Choice)
4.7/5 (35)
TABLE 18-2
A political pollster randomly selects a sample of 100 voters each day for 8 successive days and asks how many will vote for the incumbent.The pollster wishes to construct a p chart to see if the percentage favoring the incumbent candidate is too erratic. 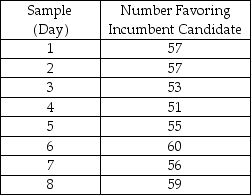 -Referring to Table 18-2,what is the numerical value of the lower control limit for the p chart?
(Multiple Choice)
4.8/5 (30)
TABLE 18-10
Below is the number of defective items from a production line over twenty consecutive morning shifts.
-Referring to Table 18-10,a c chart is to be constructed for the number of defective items.The center line of this c chart is located at ________.
(Short Answer)
4.8/5 (27)
TABLE 18-1
A local newspaper has 10 delivery boys who each deliver the morning paper to 50 customers every day.The owner decides to record the number of papers delivered on time for a 10-day period for one of the delivery boys and construct a p chart to see whether the percentage is too erratic. 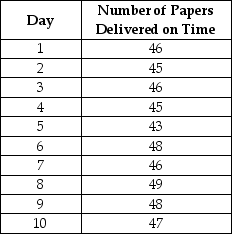 -Referring to Table 18-1,which expression best characterizes the p chart?
(Multiple Choice)
4.9/5 (29)
TABLE 18-8
Recently,a university switched to a new type of computer-based registration.The registrar is concerned with the amount of time students are spending on the computer registering under the new system.She decides to randomly select 8 students on each of the 12 days of the registration and determine the time each spends on the computer registering.The range,mean,and standard deviation of the times required to register are in the table that follows.
-Referring to Table 18-8,construct an  chart for the time required to register.
(Essay)
4.9/5 (48)
TABLE 18-7
A supplier of silicone sheets for producers of computer chips wants to evaluate her manufacturing process.She takes sample sizes of 5 from each day's output and counts the number of blemishes on each silicone sheet.The results from 20 days of such evaluations are presented below.
Sheet
Day 1 2 3 4 5 Mean Range
1 8 10 14 6 5 8.6 9
2 8 13 6 6 10 8.6 7
3 10 12 7 7 9 9.0 5
4 5 9 12 7 10 8.6 7
5 8 3 8 9 10 7.6 7
6 9 7 9 6 9 8.0 3
7 10 10 5 7 6 7.6 5
8 10 9 10 6 5 8.0 5
9 6 10 6 9 9 8.0 4
10 6 9 8 6 8 7.4 3
11 8 5 6 10 10 7.8 5
12 6 4 7 7 12 7.2 8
13 7 5 7 6 9 6.8 4
14 5 8 8 7 6 6.8 3
15 7 12 10 6 10 9.0 6
16 7 11 4 7 8 7.4 7
17 8 4 5 4 7 5.6 4
18 11 4 11 11 10 9.4 7
19 6 10 6 10 10 8.4 4
20 6 12 12 6 8 8.8 6
She also decides that the upper specification limit is 10 blemishes.
-Referring to Table 18-7,construct an  chart for the number of blemishes.
(Essay)
4.8/5 (36)
The cause of variation that can be reduced only by changing the system is ________ cause variation.
(Short Answer)
4.8/5 (38)
TABLE 18-7
A supplier of silicone sheets for producers of computer chips wants to evaluate her manufacturing process.She takes sample sizes of 5 from each day's output and counts the number of blemishes on each silicone sheet.The results from 20 days of such evaluations are presented below.
Sheet
Day 1 2 3 4 5 Mean Range
1 8 10 14 6 5 8.6 9
2 8 13 6 6 10 8.6 7
3 10 12 7 7 9 9.0 5
4 5 9 12 7 10 8.6 7
5 8 3 8 9 10 7.6 7
6 9 7 9 6 9 8.0 3
7 10 10 5 7 6 7.6 5
8 10 9 10 6 5 8.0 5
9 6 10 6 9 9 8.0 4
10 6 9 8 6 8 7.4 3
11 8 5 6 10 10 7.8 5
12 6 4 7 7 12 7.2 8
13 7 5 7 6 9 6.8 4
14 5 8 8 7 6 6.8 3
15 7 12 10 6 10 9.0 6
16 7 11 4 7 8 7.4 7
17 8 4 5 4 7 5.6 4
18 11 4 11 11 10 9.4 7
19 6 10 6 10 10 8.4 4
20 6 12 12 6 8 8.8 6
She also decides that the upper specification limit is 10 blemishes.
-Referring to Table 18-7,an  chart is to be used for the number of blemishes.One way to obtain the control limits is to take the grand mean and add and subtract the product of A2 times the mean of the sample ranges.For this data set,the value of A2 is ________.
(Short Answer)
4.9/5 (42)
Which famous statistician developed the 14 Points of Quality?
(Multiple Choice)
4.9/5 (34)
TABLE 18-10
Below is the number of defective items from a production line over twenty consecutive morning shifts.
-True or False: Referring to Table 18-10,based on the c chart,there appears to be a special cause of variation in the process.
(True/False)
4.9/5 (35)
TABLE 18-7
A supplier of silicone sheets for producers of computer chips wants to evaluate her manufacturing process.She takes sample sizes of 5 from each day's output and counts the number of blemishes on each silicone sheet.The results from 20 days of such evaluations are presented below.
Sheet
Day 1 2 3 4 5 Mean Range
1 8 10 14 6 5 8.6 9
2 8 13 6 6 10 8.6 7
3 10 12 7 7 9 9.0 5
4 5 9 12 7 10 8.6 7
5 8 3 8 9 10 7.6 7
6 9 7 9 6 9 8.0 3
7 10 10 5 7 6 7.6 5
8 10 9 10 6 5 8.0 5
9 6 10 6 9 9 8.0 4
10 6 9 8 6 8 7.4 3
11 8 5 6 10 10 7.8 5
12 6 4 7 7 12 7.2 8
13 7 5 7 6 9 6.8 4
14 5 8 8 7 6 6.8 3
15 7 12 10 6 10 9.0 6
16 7 11 4 7 8 7.4 7
17 8 4 5 4 7 5.6 4
18 11 4 11 11 10 9.4 7
19 6 10 6 10 10 8.4 4
20 6 12 12 6 8 8.8 6
She also decides that the upper specification limit is 10 blemishes.
-Referring to Table 18-7,an R chart is to be constructed for the number of blemishes.The lower control limit for this data set is ________.
(Short Answer)
4.7/5 (36)
Filters
- Essay(0)
- Multiple Choice(0)
- Short Answer(0)
- True False(0)
- Matching(0)