Exam 18: Statistical Applications in Quality Management
Exam 1: Defining and Collecting Data189 Questions
Exam 3: Numerical Descriptive Measures184 Questions
Exam 4: Basic Probability156 Questions
Exam 5: Discrete Probability Distributions218 Questions
Exam 6: The Normal Distribution and Other Continuous Distributions189 Questions
Exam 7: Sampling Distributions127 Questions
Exam 8: Confidence Interval Estimation196 Questions
Exam 9: Fundamentals of Hypothesis Testing: One-Sample Tests170 Questions
Exam 10: Two-Sample Tests210 Questions
Exam 11: Analysis of Variance130 Questions
Exam 12: Chi-Square Tests and Nonparametric Tests175 Questions
Exam 13: Simple Linear Regression213 Questions
Exam 14: Introduction to Multiple Regression337 Questions
Exam 15: Multiple Regression Model Building96 Questions
Exam 16: Time-Series Forecasting165 Questions
Exam 17: A Roadmap for Analyzing Data303 Questions
Exam 18: Statistical Applications in Quality Management130 Questions
Exam 19: Decision Making126 Questions
Exam 20: Index Numbers44 Questions
Exam 21: Chi-Square Tests for the Variance or Standard Deviation11 Questions
Exam 22: Mcnemar Test for the Difference Between Two Proportions Related Samples15 Questions
Exam 25: The Analysis of Means Anom2 Questions
Exam 23: The Analysis of Proportions Anop3 Questions
Exam 24: The Randomized Block Design85 Questions
Exam 26: The Power of a Test41 Questions
Exam 27: Estimation and Sample Size Determination for Finite Populations13 Questions
Exam 28: Application of Confidence Interval Estimation in Auditing13 Questions
Exam 29: Sampling From Finite Populations20 Questions
Exam 30: The Normal Approximation to the Binomial Distribution27 Questions
Exam 31: Counting Rules14 Questions
Exam 32: Lets Get Started Big Things to Learn First33 Questions
Select questions type
TABLE 18-4
A factory supervisor is concerned that the time it takes workers to complete an important production task (measured in seconds)is too erratic and adversely affects expected profits.The supervisor proceeds by randomly sampling 5 individuals per hour for a period of 10 hours.The sample mean and range for each hour are listed below. 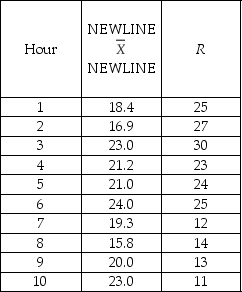 She also decides that lower and upper specification limit for the critical-to-quality variable should be 10 and 30 seconds,respectively.
-Referring to Table 18-4,what is the value of the CPL index?
She also decides that lower and upper specification limit for the critical-to-quality variable should be 10 and 30 seconds,respectively.
-Referring to Table 18-4,what is the value of the CPL index?
(Short Answer)
4.8/5  (34)
(34)
True or False: CPL > 1 implies that the process mean is more than 3 standard deviations away from the lower specification limit.
(True/False)
4.9/5 (38)
TABLE 18-4
A factory supervisor is concerned that the time it takes workers to complete an important production task (measured in seconds)is too erratic and adversely affects expected profits.The supervisor proceeds by randomly sampling 5 individuals per hour for a period of 10 hours.The sample mean and range for each hour are listed below. She also decides that lower and upper specification limit for the critical-to-quality variable should be 10 and 30 seconds,respectively.
-True or False: The control limits are based on the standard deviation of the process.
(True/False)
4.9/5 (34)
TABLE 18-5
A manufacturer of computer disks took samples of 240 disks on 15 consecutive days.The number of disks with bad sectors was determined for each of these samples.The results are in the table that follows. 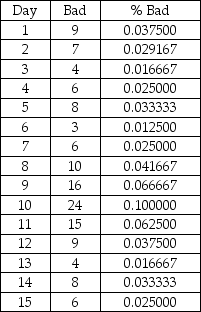 -Referring to Table 18-5,construct a p control chart for these data.
(Essay)
4.9/5 (35)
TABLE 18-4
A factory supervisor is concerned that the time it takes workers to complete an important production task (measured in seconds)is too erratic and adversely affects expected profits.The supervisor proceeds by randomly sampling 5 individuals per hour for a period of 10 hours.The sample mean and range for each hour are listed below. She also decides that lower and upper specification limit for the critical-to-quality variable should be 10 and 30 seconds,respectively.
-Referring to Table 18-4,suppose the supervisor constructs an R chart to see if the variability in collection times is in-control.This R chart is characterized by which of the following?
(Multiple Choice)
4.9/5 (37)
Which of the following is a method for breaking process into a series of steps in order to eliminate defects and produce near perfect results?
(Multiple Choice)
4.9/5 (37)
TABLE 18-4
A factory supervisor is concerned that the time it takes workers to complete an important production task (measured in seconds)is too erratic and adversely affects expected profits.The supervisor proceeds by randomly sampling 5 individuals per hour for a period of 10 hours.The sample mean and range for each hour are listed below. She also decides that lower and upper specification limit for the critical-to-quality variable should be 10 and 30 seconds,respectively.
-True or False: The purpose of a control chart is to eliminate common cause variation.
(True/False)
4.8/5 (31)
TABLE 18-4
A factory supervisor is concerned that the time it takes workers to complete an important production task (measured in seconds)is too erratic and adversely affects expected profits.The supervisor proceeds by randomly sampling 5 individuals per hour for a period of 10 hours.The sample mean and range for each hour are listed below. She also decides that lower and upper specification limit for the critical-to-quality variable should be 10 and 30 seconds,respectively.
-True or False: Common causes of variation are correctable without modifying the system.
(True/False)
4.9/5 (34)
TABLE 18-7
A supplier of silicone sheets for producers of computer chips wants to evaluate her manufacturing process.She takes sample sizes of 5 from each day's output and counts the number of blemishes on each silicone sheet.The results from 20 days of such evaluations are presented below.
Sheet
Day 1 2 3 4 5 Mean Range
1 8 10 14 6 5 8.6 9
2 8 13 6 6 10 8.6 7
3 10 12 7 7 9 9.0 5
4 5 9 12 7 10 8.6 7
5 8 3 8 9 10 7.6 7
6 9 7 9 6 9 8.0 3
7 10 10 5 7 6 7.6 5
8 10 9 10 6 5 8.0 5
9 6 10 6 9 9 8.0 4
10 6 9 8 6 8 7.4 3
11 8 5 6 10 10 7.8 5
12 6 4 7 7 12 7.2 8
13 7 5 7 6 9 6.8 4
14 5 8 8 7 6 6.8 3
15 7 12 10 6 10 9.0 6
16 7 11 4 7 8 7.4 7
17 8 4 5 4 7 5.6 4
18 11 4 11 11 10 9.4 7
19 6 10 6 10 10 8.4 4
20 6 12 12 6 8 8.8 6
She also decides that the upper specification limit is 10 blemishes.
-Referring to Table 18-7,what is the value of the CPU index?
(Short Answer)
4.9/5 (35)
Which of the following is not part of the DMAIC process in Six Sigma management?
(Multiple Choice)
4.7/5 (32)
TABLE 18-1
A local newspaper has 10 delivery boys who each deliver the morning paper to 50 customers every day.The owner decides to record the number of papers delivered on time for a 10-day period for one of the delivery boys and construct a p chart to see whether the percentage is too erratic. 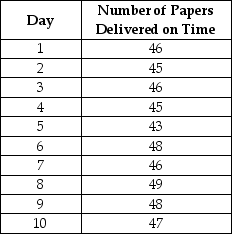 -Referring to Table 18-1,what is the numerical value of the lower control limit for the p chart?
(Multiple Choice)
5.0/5 (35)
TABLE 18-4
A factory supervisor is concerned that the time it takes workers to complete an important production task (measured in seconds)is too erratic and adversely affects expected profits.The supervisor proceeds by randomly sampling 5 individuals per hour for a period of 10 hours.The sample mean and range for each hour are listed below. She also decides that lower and upper specification limit for the critical-to-quality variable should be 10 and 30 seconds,respectively.
-Referring to Table 18-4,what is the value of the CPU index?
(Short Answer)
4.8/5 (35)
True or False: The smaller the capability index,the more capable a process is of meeting customer requirements.
(True/False)
4.9/5 (35)
True or False: A process capability is estimated by the percentage of product or service that fall outside the specification limits.
(True/False)
4.9/5 (42)
True or False: Cpk > 1 indicates that the process average is exactly 3 standard deviations away from the closest specification limit.
(True/False)
4.7/5 (31)
Which of the following situations suggests a process that appears to be operating out of statistical control?
(Multiple Choice)
4.8/5 (32)
TABLE 18-4
A factory supervisor is concerned that the time it takes workers to complete an important production task (measured in seconds)is too erratic and adversely affects expected profits.The supervisor proceeds by randomly sampling 5 individuals per hour for a period of 10 hours.The sample mean and range for each hour are listed below. She also decides that lower and upper specification limit for the critical-to-quality variable should be 10 and 30 seconds,respectively.
-True or False: In the United States,the control limits on a control chart are placed so that they are 3 standard deviations above and below a central line.
(True/False)
4.8/5 (34)
TABLE 18-4
A factory supervisor is concerned that the time it takes workers to complete an important production task (measured in seconds)is too erratic and adversely affects expected profits.The supervisor proceeds by randomly sampling 5 individuals per hour for a period of 10 hours.The sample mean and range for each hour are listed below. She also decides that lower and upper specification limit for the critical-to-quality variable should be 10 and 30 seconds,respectively.
-Referring to Table 18-4,what is the value of the Cp index?
(Short Answer)
4.9/5 (40)
TABLE 18-2
A political pollster randomly selects a sample of 100 voters each day for 8 successive days and asks how many will vote for the incumbent.The pollster wishes to construct a p chart to see if the percentage favoring the incumbent candidate is too erratic. 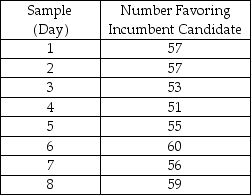 -Referring to Table 18-2,what is the numerical value of the upper control limit for the p chart?
(Multiple Choice)
4.7/5 (33)
Filters
- Essay(0)
- Multiple Choice(0)
- Short Answer(0)
- True False(0)
- Matching(0)