Exam 20: Time-Series Analysis and Forecasting
Exam 1: What Is Statistics39 Questions
Exam 2: Graphical Descriptive Techniques I89 Questions
Exam 3: Graphical Descriptive Techniques II179 Questions
Exam 4: A: Numerical Descriptive Techniques202 Questions
Exam 4: B: Numerical Descriptive Techniques39 Questions
Exam 4: C: Numerical Descriptive Techniques18 Questions
Exam 5: Data Collection and Sampling76 Questions
Exam 6: Probability223 Questions
Exam 7: A: Random Variables and Discrete Probability Distributions225 Questions
Exam 7: B: Random Variables and Discrete Probability Distributions44 Questions
Exam 8: Continuous Probability Distributions200 Questions
Exam 9: Sampling Distributions150 Questions
Exam 10: Introduction to Estimation143 Questions
Exam 11: Introduction to Hypothesis Testing179 Questions
Exam 12: Inference About a Population149 Questions
Exam 13: Inference About Comparing Two Populations169 Questions
Exam 14: Analysis of Variance154 Questions
Exam 15: Chi-Squared Tests174 Questions
Exam 16: A: Simple Linear Regression and Correlation246 Questions
Exam 16: B: Simple Linear Regression and Correlation47 Questions
Exam 17: Multiple Regression156 Questions
Exam 18: Model Building137 Questions
Exam 19: Nonparametric Statistics171 Questions
Exam 20: Time-Series Analysis and Forecasting217 Questions
Exam 21: Statistical Process Control133 Questions
Exam 22: Decision Analysis121 Questions
Exam 23: Conclusion45 Questions
Select questions type
Which of the following will be reflected by deseasonalized time series?
(Multiple Choice)
4.8/5  (40)
(40)
If we have 5 years of monthly observations,we may use the first four years to develop several competing forecasting models,and then use them to forecast the fifth year.Since we know the actual values in the fifth year,we can choose the technique that results in the most accurate forecast using either the mean absolute deviation (MAD)or the sum of squares for forecast error (SSE).
(True/False)
4.8/5 (36)
After estimating a trend model for annual time-series data,you obtain the following residual plot against time. 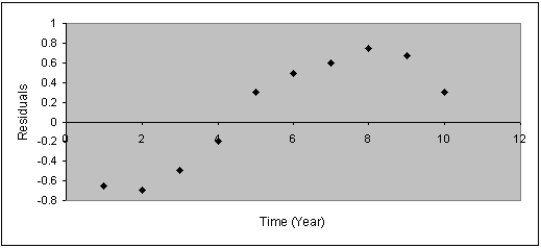 The problem with your model is that:
(Multiple Choice)
4.9/5 (33)
A time series is shown in the table below:
Week Day 1 2 3 4 Manday 16 15 18 21 Tuesday 22 21 20 25 Wednesday 20 23 20 24 Thursday 29 28 32 28 Friday 35 31 29 36 Compute the five-day moving averages to remove the seasonal and random variation.
(Essay)
4.8/5 (37)
A least squares ____________________ trend line is just a simple regression line with the years recoded.
(Essay)
4.8/5 (31)
Which of the following is not an advantage of exponential smoothing?
(Multiple Choice)
4.8/5 (45)
A time series for the years 1996-2001 is shown below.
Year 1996 125 1997 115 1998 120 1999 126 2000 140 2001 122 The forecasts for the years 2002-2004 with three smoothing constant values are:
With w = .2,F2002 = F2003 = F2004 = 125.60
With w = .5,F2002 = F2003 = F2004 = 126.75
With w = .6,F2002 = F2003 = F2004 = 126.55
Compare each of the three sets of forecasts with the actual values for 2002-2004 given in the accompanying table,and compute the mean absolute deviation (MAD)for each model.Which model is best?
Year 2002 130 2003 125 2004 135
(Essay)
5.0/5 (34)
If we want to measure the seasonal variations on stock market performance by month,we would need:
(Multiple Choice)
4.9/5 (33)
The regression trend line for annual energy consumption for 2000-2020 is given by = 70 + 0.50t,where t = 1 for 2000.If the annual energy consumption for 2015 was 72.5,then the percentage of trend for 2015 was:
(Multiple Choice)
4.9/5 (40)
Microprocessors
Annual production (in millions)of computer microprocessors in a large electronics company was recorded as shown below
Year t Production 2011 1 26 2012 2 23 2013 3 21 2014 4 25 2015 5 32 2016 6 38 2017 7 43 2018 8 36 2019 9 29 2020 10 25
-{Microprocessors Narrative} Describe the cyclical effect (if there is one).
(Essay)
4.7/5 (38)
The mean absolute deviation is the summation of the residuals divided by the sample size.
(True/False)
4.8/5 (43)
Daily Hoagie Sales
The table below shows the number of hoagies sold daily during a four-week period at Hoagie Haven in Sutton,West Virginia.
Week Day 1 2 3 4 Sunday 253 234 248 232 Monday 98 93 99 104 Tuesday 106 88 87 115 Wednesday 119 134 113 102 Thursday 138 123 130 118 Friday 201 215 218 205 Saturday 327 399 415 390
-{Daily Hoagie Sales Narrative} Calculate the seasonal (daily)indexes,using a seven-day moving average.
(Essay)
4.8/5 (38)
Biodiesel Sales
Biodiesel (a vegetable oil or animal fat based diesel fuel)sales in Nebraska have been recorded over the past 10 months as shown below.
Month Jan. Feb. March April May June July Aug. Sept. Oct. Sales 75 72 81 92 90 105 112 107 110 93
-{Biodiesel Sales Narrative} Compute the five-month moving average.
(Essay)
4.9/5 (40)
The way a seasonal index is computed involves which of the following steps?
(Multiple Choice)
4.8/5 (38)
Liquor Sales
The number of cases of liquor sold by a liquor wholesaler in an 8-year period follows.
2011 270 2012 356 2013 398 2014 456 2015 358 2016 500 2017 410 2018 376
-{Liquor Sales Narrative} Exponential smoothing with a weight or smoothing constant of 0.4 will be used to smooth the liquor sales.The smoothed value for 2012 is_________________.
(Essay)
5.0/5 (36)
The term "seasonal variation" may refer to the four traditional seasons,or to systematic patterns that occur during a month,a week,or even one day.
(True/False)
4.8/5 (42)
We calculate the three-period moving average for a time series for all time periods except the first period.
(True/False)
4.8/5 (48)
The method of least squares is used on time-series data for
(Multiple Choice)
4.8/5 (36)
The equation: St = w .yt + (1- w).St - 1 (for t 2)refers to exponentially smoothed time series.
(True/False)
4.8/5 (47)
Based on the following scatter plot,which of the time-series components is not present in this quarterly time series? 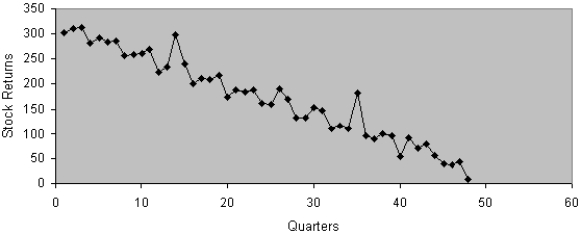
(Multiple Choice)
4.8/5 (40)
Filters
- Essay(0)
- Multiple Choice(0)
- Short Answer(0)
- True False(0)
- Matching(0)