Exam 2: Graphical Descriptive Techniques I
Exam 1: What Is Statistics39 Questions
Exam 2: Graphical Descriptive Techniques I89 Questions
Exam 3: Graphical Descriptive Techniques II179 Questions
Exam 4: A: Numerical Descriptive Techniques202 Questions
Exam 4: B: Numerical Descriptive Techniques39 Questions
Exam 4: C: Numerical Descriptive Techniques18 Questions
Exam 5: Data Collection and Sampling76 Questions
Exam 6: Probability223 Questions
Exam 7: A: Random Variables and Discrete Probability Distributions225 Questions
Exam 7: B: Random Variables and Discrete Probability Distributions44 Questions
Exam 8: Continuous Probability Distributions200 Questions
Exam 9: Sampling Distributions150 Questions
Exam 10: Introduction to Estimation143 Questions
Exam 11: Introduction to Hypothesis Testing179 Questions
Exam 12: Inference About a Population149 Questions
Exam 13: Inference About Comparing Two Populations169 Questions
Exam 14: Analysis of Variance154 Questions
Exam 15: Chi-Squared Tests174 Questions
Exam 16: A: Simple Linear Regression and Correlation246 Questions
Exam 16: B: Simple Linear Regression and Correlation47 Questions
Exam 17: Multiple Regression156 Questions
Exam 18: Model Building137 Questions
Exam 19: Nonparametric Statistics171 Questions
Exam 20: Time-Series Analysis and Forecasting217 Questions
Exam 21: Statistical Process Control133 Questions
Exam 22: Decision Analysis121 Questions
Exam 23: Conclusion45 Questions
Select questions type
Twenty-five voters participating in a recent election exit poll in Minnesota were asked to state their political party affiliation.Coding the data as R for Republican,D for Democrat,and I for Independent,the data collected were as follows: I,R,D,I,R,I,I,D,R,I,I,D,R,R,I,D,I,R,I,D,I,D,R,R,and I.Construct a frequency bar chart from this data.What does the bar chart tell you about the political affiliations of those in this sample?
Free
(Essay)
4.8/5  (41)
(41)
Correct Answer: Verified
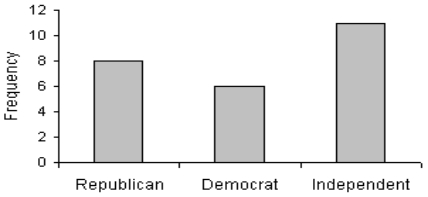 The bar graph shows most of the people surveyed were Independents (11 out of 25 = 44.0%);Republications followed with 8/25 = 32.0% and Democrats made up 6 of the 25,or 24.0%.
Suppose you measure the number of minutes it takes an employee to complete a task,where the maximum allowed time is 5 minutes,and each time is rounded to the nearest minute.Data from 130 employees is summarized below.Construct a frequency bar chart and a pie chart from this data.How long did it take most employees to complete the task?
Time (minutes) 1 2 3 4 5 Frequency 15 30 40 25 20
Free
(Essay)
4.8/5 (34)
Correct Answer:Verified
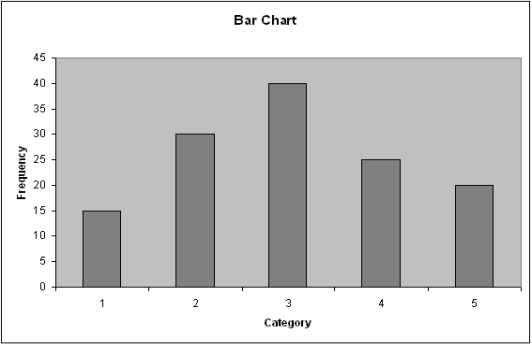
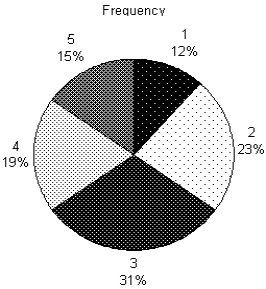 The most common time to complete the task was 3 minutes,which was recorded for 40 of the 130 (31%)of the employees.
A variable is some characteristic of a population or sample.
Free
(True/False)
4.9/5 (41)
Correct Answer:Verified
True
In the following cross-classification table,how are gender and house ownership related? Owa a house Dan't own a house Females 60 30 Males 80 40
(Multiple Choice)
4.9/5 (35)
If two bar charts made from the rows of a cross-classification table look the same,then the two nominal variables ____________________ (are/are not)related.
(Essay)
4.8/5 (34)
If two pie charts made from the rows of a cross-classification table look the same,then the two nominal variables ____________________ (are/are not)related.
(Essay)
4.8/5 (39)
In the following cross-classification table,gender and fantasy baseball participation are related.
Participate in Fantasy Football Dan't participate in Fantasy Football Males 75 25 Females 45 55
(True/False)
4.7/5 (35)
Business School Graduates
A sample of business school graduates were asked what their major was.The results are shown in the following frequency distribution.
Majar of Graduates Number of gradiuates Accounting 58 Finance 42 Management 38 Marketing 52 Other 10
-{Business School Graduates Narrative} How many graduates were surveyed?
(Essay)
4.9/5 (27)
For what type of data are frequencies the only calculations that can be done?
(Multiple Choice)
4.9/5 (40)
The classification of student major (accounting,economics,management,marketing,other)is an example of a(n)
(Multiple Choice)
4.7/5 (42)
With nominal data,there is one and only one way the possible values can be ordered.
(True/False)
4.8/5 (43)
You cannot calculate and interpret differences between numbers assigned to ordinal data.
(True/False)
4.9/5 (30)
A(n)____________________ distribution lists the categories of a nominal variable and the proportion with which each occurs.
(Essay)
4.8/5 (39)
When studying the responses to two nominal questions,we should develop a
(Multiple Choice)
4.8/5 (32)
A cross-classification table summarizes data from two nominal variables.
(True/False)
4.7/5 (36)
Suppose you measure the number of minutes it takes an employee to complete a task,where the maximum allowed time is 5 minutes,and each time is rounded to the nearest minute.Data from 130 employees is summarized below.How long did it take most employees to complete the task? Time (minutes) 1 2 3 4 5 Frequency 25 40 50 35 30
(Multiple Choice)
4.8/5 (43)
All-Nighters
A sample of 400 students at a certain university was taken after the midterm;200 students reported staying up all night before the midterm and the other 200 students did not.Researchers recorded whether each student did well or poorly on the midterm.The following table contains the results.
Did Well on Did Poorly on
Midterm Midterm
Stayed up all night 60 140
Did not stay up all night 120 80
-{All-Nighters Narrative} Of those who did well on the midterm,what percentage stayed up all night before the midterm?
(Essay)
4.7/5 (29)
Filters
- Essay(0)
- Multiple Choice(0)
- Short Answer(0)
- True False(0)
- Matching(0)