Exam 13: Inference About Comparing Two Populations
Exam 1: What Is Statistics39 Questions
Exam 2: Graphical Descriptive Techniques I89 Questions
Exam 3: Graphical Descriptive Techniques II179 Questions
Exam 4: A: Numerical Descriptive Techniques202 Questions
Exam 4: B: Numerical Descriptive Techniques39 Questions
Exam 4: C: Numerical Descriptive Techniques18 Questions
Exam 5: Data Collection and Sampling76 Questions
Exam 6: Probability223 Questions
Exam 7: A: Random Variables and Discrete Probability Distributions225 Questions
Exam 7: B: Random Variables and Discrete Probability Distributions44 Questions
Exam 8: Continuous Probability Distributions200 Questions
Exam 9: Sampling Distributions150 Questions
Exam 10: Introduction to Estimation143 Questions
Exam 11: Introduction to Hypothesis Testing179 Questions
Exam 12: Inference About a Population149 Questions
Exam 13: Inference About Comparing Two Populations169 Questions
Exam 14: Analysis of Variance154 Questions
Exam 15: Chi-Squared Tests174 Questions
Exam 16: A: Simple Linear Regression and Correlation246 Questions
Exam 16: B: Simple Linear Regression and Correlation47 Questions
Exam 17: Multiple Regression156 Questions
Exam 18: Model Building137 Questions
Exam 19: Nonparametric Statistics171 Questions
Exam 20: Time-Series Analysis and Forecasting217 Questions
Exam 21: Statistical Process Control133 Questions
Exam 22: Decision Analysis121 Questions
Exam 23: Conclusion45 Questions
Select questions type
Undergraduates' Test Scores
35 undergraduate students who completed two years of college were asked to take a basic mathematics test.The mean and standard deviation of their scores were 75.1 and 12.8,respectively.In a random sample of 50 students who only completed high school,the mean and standard deviation of the test scores were 72.1 and 14.6,respectively.
-{Undergraduates' Test Scores Narrative} Explain how to use the interval estimate to test the hypotheses.
(Essay)
4.8/5  (31)
(31)
Senatorial Election
A political poll immediately prior to a senatorial election reveals that 145 out of 250 male voters and 105 out of 200 female voters intend to vote for the Democrat candidate.
-{Senatorial Election Narrative} Explain how to use the interval estimate to test the hypotheses.
(Essay)
4.9/5 (30)
Headache Medicine
A researcher wants to see if/how men and women differ in their reaction to a headache medicine with respect to drowsiness.In testing the hypotheses  vs.
vs.  ,the following statistics were obtained: n1 = 400,x1 = 208,n2 = 250,and x2 = 115,where x1 and x2 represent the number of patients in the two samples (men vs.women)who reported to have drowsiness as a result of taking headache medicine.
-{Headache Medicine Narrative} What conclusion can we draw at the 10% significance level?
,the following statistics were obtained: n1 = 400,x1 = 208,n2 = 250,and x2 = 115,where x1 and x2 represent the number of patients in the two samples (men vs.women)who reported to have drowsiness as a result of taking headache medicine.
-{Headache Medicine Narrative} What conclusion can we draw at the 10% significance level?
(Essay)
4.8/5 (32)
In testing the difference between the means of two normally distributed populations,the number of degrees of freedom associated with the unequal-variances t-test statistic usually results in a non-integer number.It is recommended that you:
(Multiple Choice)
4.8/5 (32)
When the sample sizes are equal,the pooled variance of the two samples is the weighted average of the two sample variances.
(True/False)
4.9/5 (31)
For testing the difference between two population proportions,the pooled proportion estimate is found by taking:
(Multiple Choice)
4.9/5 (33)
A political analyst in Iowa surveys a random sample of registered Republicans and compares the results with those obtained from a random sample of registered Democrats .This would be an example of two independent samples.
(True/False)
4.8/5 (29)
Additives
A food processor wants to compare two additives for their effects on retarding spoilage.Suppose 16 cuts of fresh meat are treated with additive A and 16 are treated with additive B,and the number of hours until spoilage begins is recorded for each of the 32 cuts of meat.The results are summarized in the table below
 -Two measurements from the same individuals is an example of data collected from a matched pairs experiment.
(True/False)
4.7/5 (34)
Additives
A food processor wants to compare two additives for their effects on retarding spoilage.Suppose 16 cuts of fresh meat are treated with additive A and 16 are treated with additive B,and the number of hours until spoilage begins is recorded for each of the 32 cuts of meat.The results are summarized in the table below
-{Additives Narrative} State the null and alternative hypotheses to determine if the average number of hours until spoilage begins differs for the additives A and B.
(Essay)
4.9/5 (29)
In testing the hypothesis  vs.
vs.  ,two random samples from two normal populations produced the following statistics:
 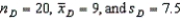 .What conclusion can we draw at the 1% significance level?
(Essay)
4.8/5 (28)
The difference in two sample proportions is a(n)____________________ estimator of the difference in their respective population proportions.
(Essay)
4.8/5 (40)
Pooling is made possible by hypothesizing (under the null hypothesis)that p1 = p2.
(True/False)
4.9/5 (34)
In testing the difference between two population means using two independent samples,the sampling distribution of the sample mean difference  is normal if the sample sizes are both greater than 30.
(True/False)
4.9/5 (36)
Clinic Waiting Time
In a random sample of 20 patients who visited a clinic at Medical Center 1,a researcher found that the variance of the waiting time (in minutes)was 128.0.In a random sample of 15 patients in the clinic of Medical Center 2,the researcher found the variance to be 178.8.
-{Clinic Waiting Time Narrative} Can we infer at the 5% level of significance that the population variances differ?
(Essay)
4.8/5 (40)
When we test for differences between the means of two independent populations,we can only use a two-tailed test.
(True/False)
4.9/5 (33)
A required condition for using the normal approximation to the binomial in testing the difference between two population proportions is that n1p1 30 and n2p2 30.
(True/False)
4.7/5 (37)
Speed Limits Violation
Do out-of-state motorists violate the speed limit more frequently than in-state motorists? This vital question was addressed by the highway patrol in a large eastern state.A random sample of the speeds of 2,500 randomly selected cars was categorized according to whether the car was registered in the state or in some other state and whether or not the car was violating the speed limit.The data follow.
 -{Speed Limits Violation Narrative} Estimate with 95% confidence the difference in population proportions.
(Essay)
4.8/5 (33)
The test statistic employed to test  is
is  is F-distributed with v1 = n1 - 1 and v2 = n2 - 1 degrees of freedom if the two populations are F-distributed.
(True/False)
4.8/5 (27)
Worker Safety
An OSHA agent wanted to determine if efforts to promote safety have been successful.By checking the records of 250 workers,he found that 30 of them suffered either minor or major injuries that year.A random sample of 400 workers last year revealed that 80 suffered some form of injury.
-{Worker Safety Narrative} What is the p-value of the test? Explain how to use it for testing the hypotheses.
(Essay)
4.7/5 (38)
Filters
- Essay(0)
- Multiple Choice(0)
- Short Answer(0)
- True False(0)
- Matching(0)