Exam 13: Inference About Comparing Two Populations
Exam 1: What Is Statistics39 Questions
Exam 2: Graphical Descriptive Techniques I89 Questions
Exam 3: Graphical Descriptive Techniques II179 Questions
Exam 4: A: Numerical Descriptive Techniques202 Questions
Exam 4: B: Numerical Descriptive Techniques39 Questions
Exam 4: C: Numerical Descriptive Techniques18 Questions
Exam 5: Data Collection and Sampling76 Questions
Exam 6: Probability223 Questions
Exam 7: A: Random Variables and Discrete Probability Distributions225 Questions
Exam 7: B: Random Variables and Discrete Probability Distributions44 Questions
Exam 8: Continuous Probability Distributions200 Questions
Exam 9: Sampling Distributions150 Questions
Exam 10: Introduction to Estimation143 Questions
Exam 11: Introduction to Hypothesis Testing179 Questions
Exam 12: Inference About a Population149 Questions
Exam 13: Inference About Comparing Two Populations169 Questions
Exam 14: Analysis of Variance154 Questions
Exam 15: Chi-Squared Tests174 Questions
Exam 16: A: Simple Linear Regression and Correlation246 Questions
Exam 16: B: Simple Linear Regression and Correlation47 Questions
Exam 17: Multiple Regression156 Questions
Exam 18: Model Building137 Questions
Exam 19: Nonparametric Statistics171 Questions
Exam 20: Time-Series Analysis and Forecasting217 Questions
Exam 21: Statistical Process Control133 Questions
Exam 22: Decision Analysis121 Questions
Exam 23: Conclusion45 Questions
Select questions type
Additives
A food processor wants to compare two additives for their effects on retarding spoilage.Suppose 16 cuts of fresh meat are treated with additive A and 16 are treated with additive B,and the number of hours until spoilage begins is recorded for each of the 32 cuts of meat.The results are summarized in the table below
 -{Additives Narrative} Assume population variances are equal.Calculate the pooled variance and the value of the test statistic.
(Essay)
4.9/5  (25)
(25)
Two independent samples of sizes 25 and 35 are randomly selected from two normal populations with equal variances (assumed to be unknown).In order to test the difference between the population means,the test statistic is:
(Multiple Choice)
4.9/5 (37)
In testing the difference between two population means using two independent samples,we use the pooled variance in estimating the standard error of the sampling distribution of the sample mean difference  if:
if:
(Multiple Choice)
4.8/5 (37)
The unequal-variances test statistic of  has an approximate ____________________ distribution with
 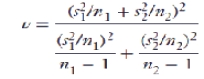 degrees of freedom.
(Essay)
4.9/5 (27)
The test for the mean difference in a matched pairs design requires the differences to have a(n)____________________ distribution.
(Essay)
4.8/5 (35)
If there are 10 pairs of data in a matched pairs experiment,the degrees of freedom for the corresponding t-test is 18.
(True/False)
4.7/5 (39)
When comparing two population means using data that are gathered from a matched pairs experiment,the test statistic for D is Student t-distributed with v = nD -1 degrees of freedom,provided that the differences are normally distributed.
(True/False)
4.9/5 (38)
The test statistic for testing for the equality of two population variances has an F-distribution with ____________________ and ____________________ degrees of freedom.
(Essay)
4.7/5 (41)
A matched pairs experiment decreases variability (compared to two independent samples).
(True/False)
4.8/5 (36)
The sampling distribution of the ratio of two sample variances is said to be F-distributed provided that we have two ____________________ samples drawn from their respective populations.
(Essay)
4.7/5 (35)
Two independent samples are drawn from two normal populations,where the population variances are assumed to be equal.The sampling distribution of the ratio of the two sample variances is:
(Multiple Choice)
4.9/5 (37)
Profit Margin
An investor is considering two types of investment.She is quite satisfied that the expected profit margin on Investment 1 is higher than the expected profit margin on Investment 2.However,she is quite concerned that the risk associated with Investment 1 is higher than that of Investment 2.To help make her decision,she randomly selects seven monthly profit margins on investment 1 and ten monthly profit margins on investment 2.She finds that the sample variances of Investments 1 and 2 are 225 and 118,respectively.
-{Profit Margin Narrative} Estimate with 95% confidence the ratio of the two population variances.
(Essay)
4.9/5 (34)
In testing the difference between the means of two normal populations using two independent samples when the population variances are unequal,the sampling distribution of the resulting statistic is:
(Multiple Choice)
4.7/5 (33)
When the sample sizes are equal,the pooled variance of the two samples is the ____________________ of the two sample variances.
(Essay)
4.8/5 (31)
In testing for the equality of two population variances,when the populations are normally distributed,the 10% level of significance has been used.To determine the rejection region,it will be necessary to refer to the F table corresponding to an upper-tail area of:
(Multiple Choice)
4.8/5 (26)
We compare two population variances by examining their ____________________.
(Essay)
5.0/5 (36)
A councilwoman regularly polls her constituency to gauge her level of support among voters.This month,652 out of 1158 voters support her.Five months ago,412 out of 982 voters supported her.With a 5% significance level,can she infer that support has increased by at least 10 percentage points?
(Essay)
4.7/5 (31)
The variance of the difference between two sample proportions equals the ____________________ of their population proportion variances.
(Essay)
4.9/5 (33)
Filters
- Essay(0)
- Multiple Choice(0)
- Short Answer(0)
- True False(0)
- Matching(0)