Exam 2: Graphical Descriptive Techniques I
Exam 1: What Is Statistics39 Questions
Exam 2: Graphical Descriptive Techniques I89 Questions
Exam 3: Graphical Descriptive Techniques II179 Questions
Exam 4: A: Numerical Descriptive Techniques202 Questions
Exam 4: B: Numerical Descriptive Techniques39 Questions
Exam 4: C: Numerical Descriptive Techniques18 Questions
Exam 5: Data Collection and Sampling76 Questions
Exam 6: Probability223 Questions
Exam 7: A: Random Variables and Discrete Probability Distributions225 Questions
Exam 7: B: Random Variables and Discrete Probability Distributions44 Questions
Exam 8: Continuous Probability Distributions200 Questions
Exam 9: Sampling Distributions150 Questions
Exam 10: Introduction to Estimation143 Questions
Exam 11: Introduction to Hypothesis Testing179 Questions
Exam 12: Inference About a Population149 Questions
Exam 13: Inference About Comparing Two Populations169 Questions
Exam 14: Analysis of Variance154 Questions
Exam 15: Chi-Squared Tests174 Questions
Exam 16: A: Simple Linear Regression and Correlation246 Questions
Exam 16: B: Simple Linear Regression and Correlation47 Questions
Exam 17: Multiple Regression156 Questions
Exam 18: Model Building137 Questions
Exam 19: Nonparametric Statistics171 Questions
Exam 20: Time-Series Analysis and Forecasting217 Questions
Exam 21: Statistical Process Control133 Questions
Exam 22: Decision Analysis121 Questions
Exam 23: Conclusion45 Questions
Select questions type
A survey of 100 adults was conducted to see if gender is related to pet ownership.The results are summarized in the bar chart below.Which of the following statements describes the relationship? 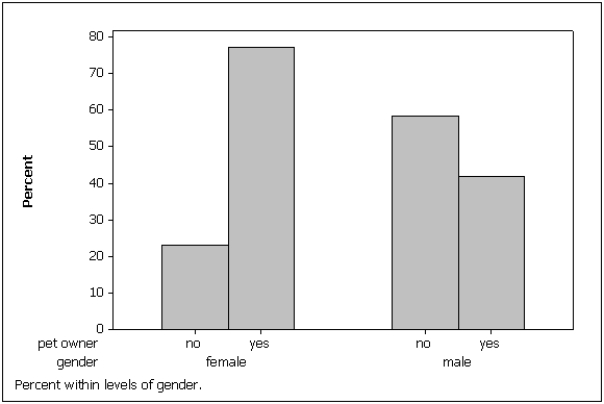
(Multiple Choice)
4.9/5  (37)
(37)
To describe the relationship between two nominal variables you make a scatter diagram and look for a correlation.
(True/False)
4.9/5 (31)
A statistics professor classifies his students according to their grade point average (GPA)and their gender.The resulting cross-classification table is shown below. GPA Gender Under 2.5 2.5-3.5 Over 3.5 Mala 5 25 10 Female 10 20 30 Which of the following describes the relationship between GPA and gender shown by this table?
(Multiple Choice)
4.7/5 (38)
Which situation identifies when to use pie charts and/or bar charts?
(Multiple Choice)
4.7/5 (44)
In the following cross-classification table,gender and car ownership are related.
Own a car Dan't awn a car Females 60 30 Males 40
(True/False)
4.9/5 (33)
Which of the following situations is best suited for a pie chart?
(Multiple Choice)
4.9/5 (40)
Business School Graduates
A sample of business school graduates were asked what their major was.The results are shown in the following frequency distribution.
Majar of Graduates Number of gradiuates Accounting 58 Finance 42 Management 38 Marketing 52 Other 10
-{Business School Graduates Narrative} Draw a pie chart of this data.Are you able to reconstruct the original data from this pie chart alone?
(Essay)
4.9/5 (27)
Which of the following statements about pie charts is false?
(Multiple Choice)
4.7/5 (29)
A category in a pie chart that contains 50% of the observations is represented by a slice of the pie that is equal to ____________________ degrees.
(Essay)
4.9/5 (32)
All-Nighters
A sample of 400 students at a certain university was taken after the midterm;200 students reported staying up all night before the midterm and the other 200 students did not.Researchers recorded whether each student did well or poorly on the midterm.The following table contains the results.
Did Well on Did Poorly on
Midterm Midterm
Stayed up all night 60 140
Did not stay up all night 120 80
-{All-Nighter Narrative} Of those who stayed up all night before the midterm,what percentage did well on the midterm?
(Essay)
4.7/5 (38)
A(n)____________________ chart is often used to display frequencies;a(n)____________________ chart graphically shows relative frequencies.
(Essay)
4.8/5 (37)
One of the advantages of a pie chart is that it clearly shows that the total percentages of all the categories add to 100%.
(True/False)
4.7/5 (32)
In purchasing an automobile,there are a number of variables to consider.The body style of the car (sedan,coupe,wagon,etc. )is an example of a(n)____________________ variable.
(Essay)
4.7/5 (37)
Using the following cross-classification table,draw two pie charts that compare pet ownership for males vs.females.Are gender and pet ownership related?
Own a pet Dan't awn a pet Females 75 25 Males 40 60
(Essay)
4.8/5 (37)
The bar charts below summarize data collected on 100 adults regarding gender and pet ownership.Which of the following statements is (are)true based on this chart? 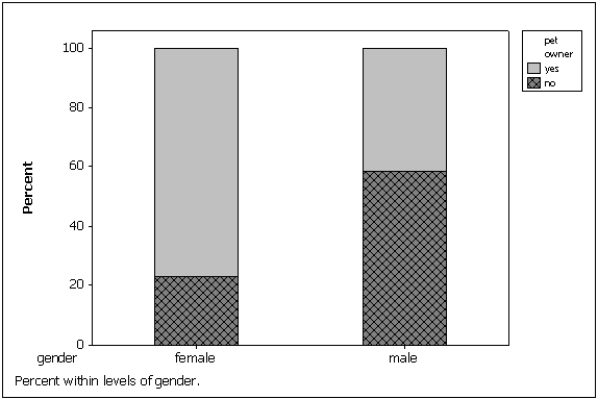
(Multiple Choice)
4.9/5 (29)
Bar and pie charts are graphical techniques for nominal data.The former focus the attention on the frequency of the occurrences of each category,and the later emphasizes the proportion of occurrences of each category.
(True/False)
4.7/5 (37)
Using the following cross-classification table,draw two bar charts that compare pet ownership for males vs.females.Are gender and pet ownership related?
Own a pet Dan't awn a pet Females 75 25 Males 40 60
(Essay)
4.8/5 (34)
Filters
- Essay(0)
- Multiple Choice(0)
- Short Answer(0)
- True False(0)
- Matching(0)