Exam 2: Graphical Descriptive Techniques I
Exam 1: What Is Statistics39 Questions
Exam 2: Graphical Descriptive Techniques I89 Questions
Exam 3: Graphical Descriptive Techniques II179 Questions
Exam 4: A: Numerical Descriptive Techniques202 Questions
Exam 4: B: Numerical Descriptive Techniques39 Questions
Exam 4: C: Numerical Descriptive Techniques18 Questions
Exam 5: Data Collection and Sampling76 Questions
Exam 6: Probability223 Questions
Exam 7: A: Random Variables and Discrete Probability Distributions225 Questions
Exam 7: B: Random Variables and Discrete Probability Distributions44 Questions
Exam 8: Continuous Probability Distributions200 Questions
Exam 9: Sampling Distributions150 Questions
Exam 10: Introduction to Estimation143 Questions
Exam 11: Introduction to Hypothesis Testing179 Questions
Exam 12: Inference About a Population149 Questions
Exam 13: Inference About Comparing Two Populations169 Questions
Exam 14: Analysis of Variance154 Questions
Exam 15: Chi-Squared Tests174 Questions
Exam 16: A: Simple Linear Regression and Correlation246 Questions
Exam 16: B: Simple Linear Regression and Correlation47 Questions
Exam 17: Multiple Regression156 Questions
Exam 18: Model Building137 Questions
Exam 19: Nonparametric Statistics171 Questions
Exam 20: Time-Series Analysis and Forecasting217 Questions
Exam 21: Statistical Process Control133 Questions
Exam 22: Decision Analysis121 Questions
Exam 23: Conclusion45 Questions
Select questions type
Data that contains information on two variables is called ____________________ data.
(Essay)
4.8/5  (30)
(30)
Give an example of interval data that can also be treated as ordinal data and nominal data.
(Essay)
4.8/5 (41)
The Dean of Students conducted a survey on campus.Class rank (Freshman,Sophomore,Junior,and Senior)is an example of a(n)____________________ variable.
(Essay)
4.8/5 (29)
Business School Graduates
A sample of business school graduates were asked what their major was.The results are shown in the following frequency distribution.
Majar of Graduates Number of gradiuates Accounting 58 Finance 42 Management 38 Marketing 52 Other 10
-{Business School Graduates Narrative} If you were only given the frequency bar chart below,would you able to reconstruct the original observations in the data set? 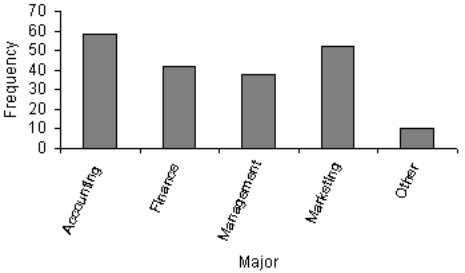
(Essay)
4.8/5 (33)
All-Nighters
A sample of 400 students at a certain university was taken after the midterm;200 students reported staying up all night before the midterm and the other 200 students did not.Researchers recorded whether each student did well or poorly on the midterm.The following table contains the results.
Did Well on Did Poorly on
Midterm Midterm
Stayed up all night 60 140
Did not stay up all night 120 80
-{All-Nighters Narrative} There is a relationship between whether or not a student stayed up all night before the midterm,and how well they did on the midterm.Describe this relationship using percentages.
(Essay)
4.8/5 (24)
Car Buyers
Forty car buyers were asked to indicate which car dealer offered the best overall service.The four choices were Contour Motors (C),Modern Chrysler (M),Tonneau Auto (T),and Uncanny Chevrolet (U).The following data were obtained:
-{Car Buyers Narrative} Construct a pie chart of this data.Which car dealer offered the best overall service?
(Essay)
5.0/5 (37)
A cross-classification table is used to describe the relationship between two ____________________ variables.
(Essay)
4.8/5 (29)
A cross-classification table is the same thing as two frequency distribution tables,one for each variable.
(True/False)
4.8/5 (33)
In a pie chart,each slice is proportional to the ____________________ of individuals in that category.
(Essay)
4.8/5 (35)
To evaluate two nominal variables at the same time,a(n)____________________ table should be created from the data.
(Essay)
4.8/5 (40)
Values must represent ordered rankings for what type of data?
(Multiple Choice)
4.8/5 (29)
If two nominal variables are unrelated,then the patterns exhibited in their corresponding pie charts should be approximately the same.If some relationship exists,then some pie charts will differ from others.
(True/False)
5.0/5 (35)
A relative frequency distribution lists the categories and their counts.
(True/False)
4.9/5 (35)
Your age group (1-9;10-19;20-29;30-39;etc. )is an interval variable.
(True/False)
4.8/5 (35)
Two hundred males and two hundred females were asked whether or not college baseball should have a playoff system (yes/no/undecided).Pie charts of the responses for males vs.females are shown below.Which of the following describes the relationship between gender and opinion? 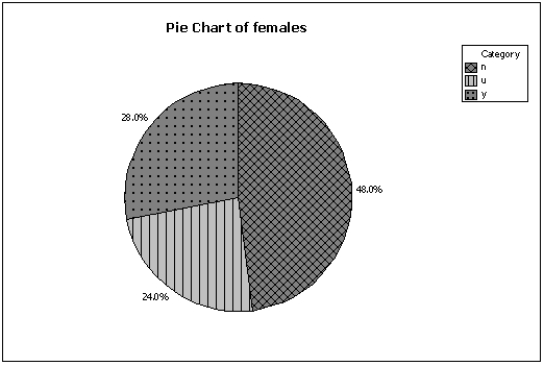
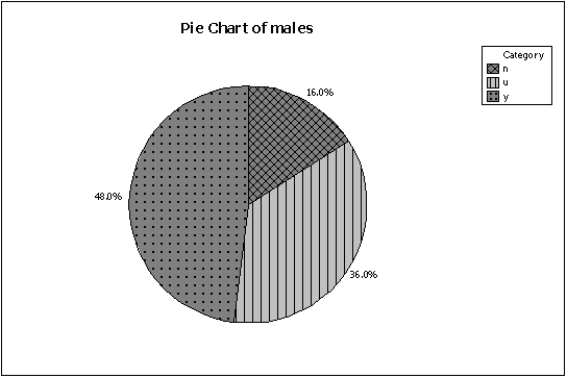
(Multiple Choice)
4.9/5 (35)
Car Buyers
Forty car buyers were asked to indicate which car dealer offered the best overall service.The four choices were Contour Motors (C),Modern Chrysler (M),Tonneau Auto (T),and Uncanny Chevrolet (U).The following data were obtained:
-{Car Buyers Narrative} Construct a frequency bar chart of this data.Which car dealer came in last place in terms of overall service?
(Essay)
4.8/5 (35)
Filters
- Essay(0)
- Multiple Choice(0)
- Short Answer(0)
- True False(0)
- Matching(0)