Exam 16: Time-Series Analysis and Index Numbers
Exam 1: Instruction and Data Collection47 Questions
Exam 2: Presenting Data in Tables and Charts277 Questions
Exam 3: Numerical Descriptive Measures139 Questions
Exam 4: Basic Probability137 Questions
Exam 5: Some Important Discrete Probability Distributions188 Questions
Exam 6: The Normal Distribution and Other Continuous Distributions164 Questions
Exam 7: Sampling and Sampling Distributions187 Questions
Exam 8: Confidence Interval Estimation173 Questions
Exam 9: Fundamentals of Hypothesis Testing: One-Sample Tests146 Questions
Exam 10: Two-Sample Tests190 Questions
Exam 11: Analysis of Variance127 Questions
Exam 12: Chi-Square Tests and Nonparametric Tests174 Questions
Exam 13: Simple Linear Regression198 Questions
Exam 14: Introduction to Multiple Regression215 Questions
Exam 15: Multiple Regression Model Building101 Questions
Exam 16: Time-Series Analysis and Index Numbers133 Questions
Exam 17: Statistical Applications in Quality Management132 Questions
Exam 18: Data Analysis Overview52 Questions
Select questions type
TABLE 16-11
Business closures in Laramie, Wyoming from 2003 to 2008 were:
 Microsoft Excel was used to fit both first-order and second-order autoregressive models, resulting in the following partial outputs:
SUMMARY OUTPUT - 2nd Order Model
Microsoft Excel was used to fit both first-order and second-order autoregressive models, resulting in the following partial outputs:
SUMMARY OUTPUT - 2nd Order Model
 SUMMARY OUTPUT - 1st Order Model
 -Referring to Table 16-11, the residuals for the first-order autoregressive model are ________, ________, ________, ________, and ________.
(Short Answer)
4.8/5  (41)
(41)
Which of the following terms describes the overall long-term tendency of a time series?
(Multiple Choice)
4.8/5 (28)
TABLE 16-7
The number of passengers arriving at San Francisco on the Amtrak cross-country express on 6 successive Mondays were: 60, 72, 96, 84, 36, and 48.
-Referring to Table 16-7, the number of arrivals will be exponentially smoothed with a smoothing constant of 0.1. The smoothed value for the sixth Monday will be ________.
(Short Answer)
4.8/5 (39)
Each forecast using the method of exponential smoothing depends on all the previous observations in the time series.
(True/False)
4.9/5 (37)
Which of the following methods should not be used for short-term forecasts into the future?
(Multiple Choice)
4.8/5 (35)
TABLE 16-2
The monthly advertising expenditures of a department store chain (in $1,000,000s) were collected over the last decade. The last 14 months of this time series follows:
 -Referring to Table 16-2, set up a scatter diagram (i.e., time-series plot) with months on the horizontal X-axis.
(Essay)
4.9/5 (36)
A trend is a persistent pattern in annual time-series data that has to be followed for several years.
(True/False)
4.7/5 (29)
The overall upward or downward pattern of the data in an annual time series will be contained in the ________ component.
(Multiple Choice)
4.9/5 (36)
TABLE 16-3
The following table contains the number of complaints received in a department store for the first 6 months of last year.
 -Referring to Table 16-3, if a three-month moving average is used to smooth this series, what would be the last calculated value?
(Multiple Choice)
4.8/5 (37)
TABLE 16-13
A local store developed a multiplicative time-series model to forecast its revenues in future quarters, using quarterly data on its revenues during the 4-year period from 2005 to 2009. The following is the resulting regression equation:

 -Referring to Table 16-13, the best interpretation of the coefficient of Q2 (-0.054) in the regression equation is:
(Multiple Choice)
4.8/5 (40)
TABLE 16-7
The number of passengers arriving at San Francisco on the Amtrak cross-country express on 6 successive Mondays were: 60, 72, 96, 84, 36, and 48.
-Referring to Table 16-7, the number of arrivals will be exponentially smoothed with a smoothing constant of 0.1. Then the forecast for the seventh Monday will be ________.
(Short Answer)
4.8/5 (42)
After estimating a trend model for annual time-series data, you obtain the following residual plot against time: 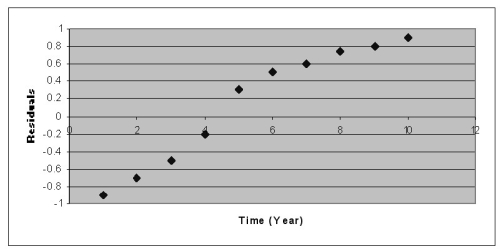 The problem with your model is that
(Multiple Choice)
4.9/5 (31)
Given a data set with 15 yearly observations, there are only seven 9-year moving averages.
(True/False)
4.8/5 (40)
TABLE 16-7
The number of passengers arriving at San Francisco on the Amtrak cross-country express on 6 successive Mondays were: 60, 72, 96, 84, 36, and 48.
-Referring to Table 16-7, the number of arrivals will be exponentially smoothed with a smoothing constant of 0.1. The smoothed value for the second Monday will be ________.
(Short Answer)
4.8/5 (38)
TABLE 16-6
The number of cases of merlot wine sold by a Paso Robles winery in an 8-year period follows.
 -Referring to Table 16-6, construct a centered 3-year moving average for the wine sales.
(Essay)
4.8/5 (29)
TABLE 16-6
The number of cases of merlot wine sold by a Paso Robles winery in an 8-year period follows.
-Referring to Table 16-6, a centered 5-year moving average is to be constructed for the wine sales. The number of moving averages that will be calculated is ________.
(Short Answer)
4.8/5 (32)
In selecting a forecasting model, we should perform a residual analysis.
(True/False)
4.9/5 (32)
TABLE 16-6
The number of cases of merlot wine sold by a Paso Robles winery in an 8-year period follows.
-Referring to Table 16-6, exponential smoothing with a weight or smoothing constant of 0.4 will be used to forecast wine sales. The forecast for 2009 is ________.
(Short Answer)
4.9/5 (41)
TABLE 16-9
The executive vice-president of a drug manufacturing firm believes that the demand for the firm's most popular drug has been evidencing an exponential trend since 1995. She uses Microsoft Excel to obtain the partial output below. The dependent variable is the log base 10 of the demand for the drug, while the independent variable is years, where 1995 is coded as 0, 1996 is coded as 1, etc.
SUMMARY OUTPUT
Regression Statistics

 -Referring to Table 16-9, the forecast for the demand in 2009 is ________.
(Short Answer)
4.7/5 (38)
Microsoft Excel was used to obtain the following quadratic trend equation:
Sales = 100 - 10X + 15X2.
The data used was from 1999 through 2008, coded 0 to 9. The forecast for 2009 is ________.
(Short Answer)
4.7/5 (35)
Filters
- Essay(0)
- Multiple Choice(0)
- Short Answer(0)
- True False(0)
- Matching(0)