Exam 5: Predictive Analytics I: Trees, K-Nearest Neighbors, Naive Bayes,
Exam 1: An Introduction to Business Statistics and Analytics98 Questions
Exam 2: Descriptive Statistics and Analytics: Tabular and Graphical Methods120 Questions
Exam 3: Descriptive Statistics and Analytics: Numerical Methods145 Questions
Exam 4: Probability and Probability Models150 Questions
Exam 5: Predictive Analytics I: Trees, K-Nearest Neighbors, Naive Bayes,101 Questions
Exam 6: Discrete Random Variables150 Questions
Exam 7: Continuous Random Variables150 Questions
Exam 8: Sampling Distributions111 Questions
Exam 9: Confidence Intervals149 Questions
Exam 10: Hypothesis Testing150 Questions
Exam 11: Statistical Inferences Based on Two Samples140 Questions
Exam 12: Experimental Design and Analysis of Variance132 Questions
Exam 13: Chi-Square Tests120 Questions
Exam 14: Simple Linear Regression Analysis147 Questions
Exam 15: Multiple Regression and Model Building85 Questions
Exam 16: Predictive Analytics Ii: Logistic Regression, Discriminate Analysis,101 Questions
Exam 17: Time Series Forecasting and Index Numbers161 Questions
Exam 18: Nonparametric Methods103 Questions
Exam 19: Decision Theory90 Questions
Select questions type
An automobile finance company analyzed a sample of recent automobile loans to try to determine key factors in identifying borrowers who would be likely to default on their auto loan. The response variable Default equals 1 if the borrower defaulted during the term of the loan and 0 otherwise. The predictor variable AutoDebt% was the ratio (expressed as a percent) of the required loan payments to the borrower's take-home income at the time of purchase. JobTime was the number of years the borrower had worked at their current job at the time of purchase. CredScore was the borrower's credit score at the time of purchase. Below is part of the classification tree the finance company derived from the data collected in the study. Assume they classify those with a default probability estimate of at least .5 as Defaulters.  A potential borrower with a credit score of 600 who has just started their current job with a monthly salary of $5,000 would like to apply for a loan. To be approved for the loan they would need to be classified as a non-Defaulter. Of the following monthly payments, which is the highest this loan could have to be approved for this potential borrower?
(Multiple Choice)
4.8/5  (34)
(34)
An automobile finance company analyzed a sample of recent automobile loans to try to determine key factors in identifying borrowers who would be likely to default on their auto loan. The response variable Default equals 1 if the borrower defaulted during the term of the loan and 0 otherwise. The predictor variable AutoDebt% was the ratio (expressed as a percent) of the required loan payments to the borrower's take-home income at the time of purchase. JobTime was the number of years the borrower had worked at their current job at the time of purchase. CredScore was the borrower's credit score at the time of purchase. Below is part of the classification tree the finance company derived from the data collected in the study. Assume they classify those with a default probability estimate of at least .5 as Defaulters.  A potential borrower with a credit score of 752 who just started their current job is applying for a loan with payments equaling 19% of their income. Based on this classification tree, the best estimate of the probability that this loan applicant would default would be
(Multiple Choice)
4.8/5 (37)
An internet service provider (ISP) has randomly selected a sample of 223 observations concerning values of the response variable Churn and several predictor variables based on customer activity during the most recently billed month. Here Churn equals Yes if a customer churned-left the internet service provider for another ISP-and equals No otherwise. The predictor variable MinutesOn is the average daily minutes the customer spent online. EmailSent is the average daily number of emails the customer sent from the email address provided by the ISP. ServCalls is the number of times the customer called for service. Below is part of the classification tree they derived from the data collected in the study. 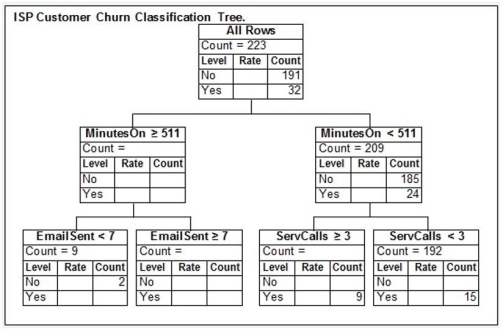 Of the sampled customers who spent an average of less than 511 minutes online per day and placed at least 3 service calls, what is the sample proportion of those who did not churn?
(Multiple Choice)
4.9/5 (25)
An MBA admissions officer wishes to predict an MBA applicant's grade point average (GPA) for the MBA program on the basis of the applicant's score on the Graduate Management Admission Test (GMAT) and their undergraduate GPA (UGPA). The admissions officer used a random sample of previously admitted applicants to build a regression tree that can be used to predict the MBA GPAs of future MBA students. Below is the final regression tree. 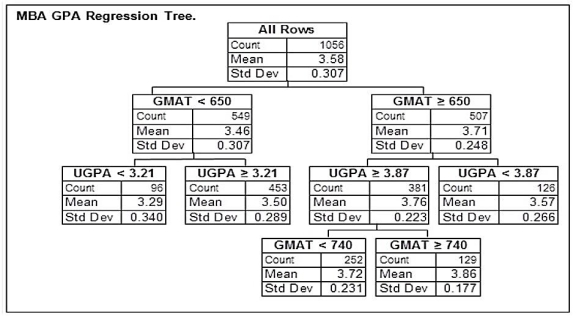 The school requires a predicted MBA GPA of at least 3.50 for an admitted applicant to be considered for a Graduate Assistantship. An MBA applicant has a GMAT score of 620. Based on this regression tree, which of the following undergraduate GPAs is the lowest this applicant can earn to be considered for a Graduate Assistantship?
(Multiple Choice)
4.9/5 (37)
An internet service provider (ISP) has randomly selected a sample of 223 observations concerning values of the response variable Churn and several predictor variables based on customer activity during the most recently billed month. Here Churn equals Yes if a customer churned-left the internet service provider for another ISP-and equals No otherwise. The predictor variable MinutesOn is the average daily minutes the customer spent online. EmailSent is the average daily number of emails the customer sent from the email address provided by the ISP. ServCalls is the number of times the customer called for service. Below is part of the classification tree they derived from the data collected in the study.  Assume they classify those with a churn probability estimate (based on the sample proportion) of at least .5 as churners. Based on this classification tree, a member of the study sample who spent an average of 327 minutes online per day, sent an average of 4 emails per day from their ISP-provided email address, placed no service calls, and churned would be
(Multiple Choice)
4.8/5 (32)
Which of the following possible response variables is most appropriate to predict using a classification tree?
(Multiple Choice)
4.8/5 (37)
Because different trust levels may be appropriate for different techniques, ensemble estimates may use a weighted average of the different results given by the different techniques.
(True/False)
4.8/5 (41)
Suppose that a bank wishes to predict whether or not an existing holder of its Silver credit card will upgrade, for an annual fee, to its Platinum credit card. To do this, the bank carries out a pilot study that randomly selects 40 of its existing Silver card holders and offers each Silver card holder an upgrade to its Platinum card. Here, the response variable Upgrade equals 1 if the Silver card holder decided to upgrade and 0 otherwise. Moreover, the predictor variable Purchases is last year's purchases (in thousands of dollars) by the Silver card holder, and the predictor variable PlatProfile equals 1 if the Silver card holder conforms to the bank's Platinum profile and 0 otherwise. Below is the classification tree they derived from the data collected in the study. 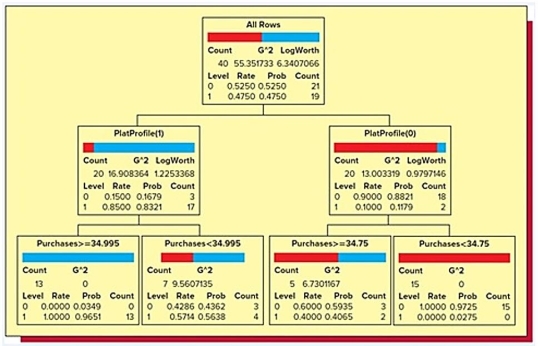 Of these 40 Silver card holders, what is the proportion that did not upgrade?
(Multiple Choice)
4.8/5 (39)
A cable television company has randomly selected a sample of 222 Basic package customers for a marketing test to see which customers are more likely to upgrade to the Premium package. They monitored two predictor variables based on customer activity during the most recently billed month. Then they included a special upgrade offer for the Premium package along with their bill. The response variable Upgrade equals True if a customer accepted the offer to upgrade to the Premium package and equals False otherwise. The predictor variable ViewTime is the average daily minutes the customer had at least one TV on in their house. Network is 1 if the TV is tuned to a traditional ("over the public airwaves") broadcast network at least 50 percent of the time that it is turned on and 0 otherwise. Let the events U, Uc, HV, and NV denote the events that the randomly selected Basic customer, respectively, upgraded, did not upgrade, had a high ViewTime [a view time greater than the median amount of 507 minutes], and was primarily a traditional broadcast network viewer [i.e., spent at least 50% of time tuned to a traditional network]. The data they collected show: 1) 43 out of 222 Basic customers upgraded, or P(U) = 43/222.
2) 179 out of 222 Basic customers did not upgrade, or P(Uc) = 179/222.
3) 37 out of 43 upgraders had a high ViewTime, or P(HV|U) = 37/43.
4) 63 out of 179 non-upgraders had a high ViewTime, or P(HV|Uc) = 63/179.
"5) 7 out of 43 upgraders was primarily a traditional broadcast network viewer,
Or P(NV|U) = 7/43."
"6) 52 out of 179 non-upgraders was primarily a traditional broadcast network viewer,
Or P(NV|Uc) = 52/179.
Using naive Bayes' Theorem, what is the approximate probability that a Basic customer will upgrade if they do not have a high ViewTime and do not primarily view traditional broadcast networks?"
(Multiple Choice)
4.9/5 (42)
An internet service provider (ISP) has randomly selected a sample of 223 observations concerning values of the response variable Churn and several predictor variables based on customer activity during the most recently billed month. Here Churn equals Yes if a customer churned-left the internet service provider for another ISP-and equals No otherwise. The predictor variable MinutesOn is the average daily minutes the customer spent online. EmailSent is the average daily number of emails the customer sent from the email address provided by the ISP. ServCalls is the number of times the customer called for service. Below is part of the classification tree they derived from the data collected in the study.  Of the 223 sampled customers, what is the sample proportion of those who churned?
(Multiple Choice)
4.8/5 (30)
An automobile finance company analyzed a sample of recent automobile loans to try to determine key factors in identifying borrowers who would be likely to default on their auto loan. The response variable Default equals 1 if the borrower defaulted during the term of the loan and 0 otherwise. The predictor variable AutoDebt% was the ratio (expressed as a percent) of the required loan payments to the borrower's take-home income at the time of purchase. JobTime was the number of years the borrower had worked at their current job at the time of purchase. CredScore was the borrower's credit score at the time of purchase. Below is part of the classification tree the finance company derived from the data collected in the study. Assume they classify those with a default probability estimate of at least .5 as Defaulters.  Based on this classification tree, a member of the study sample who had a credit score of 802, been at their current job for 1 year, took out a loan with payments equaling 19% of their income, and defaulted would be
(Multiple Choice)
4.7/5 (32)
An automobile finance company analyzed a sample of recent automobile loans to try to determine key factors in identifying borrowers who would be likely to default on their auto loan. The response variable Default equals 1 if the borrower defaulted during the term of the loan and 0 otherwise. The predictor variable AutoDebt% was the ratio (expressed as a percent) of the required loan payments to the borrower's take-home income at the time of purchase. JobTime was the number of years the borrower had worked at their current job at the time of purchase. CredScore was the borrower's credit score at the time of purchase. Below is part of the classification tree the finance company derived from the data collected in the study. Assume they classify those with a default probability estimate of at least .5 as Defaulters. 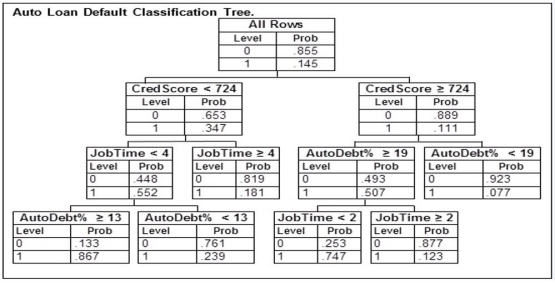 A potential borrower who has just started their current job would like to apply for a loan with payments equaling 17% of their income. To be approved for the loan they would need to be classified as a non-Defaulter. Of the following credit scores, which is the lowest this potential borrower could have to be approved for the loan?
(Multiple Choice)
4.8/5 (31)
An internet service provider (ISP) has randomly selected a sample of 223 observations concerning values of the response variable Churn and several predictor variables based on customer activity during the most recently billed month. Here Churn equals Yes if a customer churned-left the internet service provider for another ISP-and equals No otherwise. The predictor variable MinutesOn is the average daily minutes the customer spent online. EmailSent is the average daily number of emails the customer sent from the email address provided by the ISP. ServCalls is the number of times the customer called for service. Below is part of the classification tree they derived from the data collected in the study.  Of the sampled customers who spent an average of at least 511 minutes online per day and sent an average of fewer than 7 emails per day from their ISP-provided email address, what is the sample proportion of those who churned?
(Multiple Choice)
4.9/5 (40)
Which of the following possible response variables is most appropriate to predict using a regression tree?
(Multiple Choice)
4.7/5 (38)
The confusion matrix for a classification tree shows which combinations of predictor variables cannot be used to predict the response variable.
(True/False)
4.9/5 (29)
An internet service provider (ISP) has randomly selected a sample of 347 observations concerning values of the response variable Churn and several predictor variables based on customer activity during the most recently billed month. Here Churn equals Yes if a customer churned-left the internet service provider for another ISP-and equals No otherwise. The predictor variable MinutesOn is the average daily minutes the customer spent online. EmailSent is the average daily number of emails the customer sent from the email address provided by the ISP. ServCalls is the number of times the customer called for service. Below is part of the classification tree they derived from the data collected in the study. 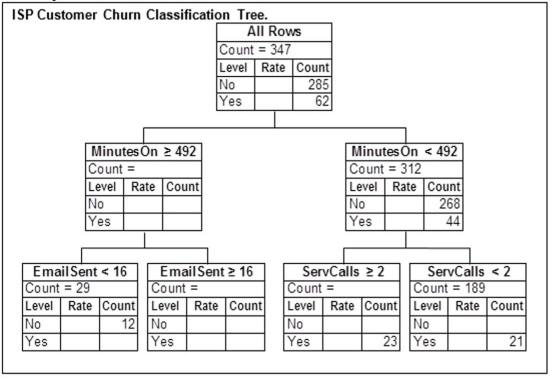 Fill in the missing counts and rates in the classification tree above.
(Short Answer)
4.8/5 (30)
Combining the estimates or predictions obtained from different analytics to arrive at an overall result is done by developing a(n) ________.
(Multiple Choice)
4.9/5 (44)
An automobile finance company analyzed a sample of recent automobile loans to try to determine key factors in identifying borrowers who would be likely to default on their auto loan. The response variable Default equals 1 if the borrower defaulted during the term of the loan and 0 otherwise. The predictor variable AutoDebt% was the ratio (expressed as a percent) of the required loan payments to the borrower's take-home income at the time of purchase. JobTime was the number of years the borrower had worked at their current job at the time of purchase. CredScore was the borrower's credit score at the time of purchase. Below is part of the classification tree the finance company derived from the data collected in the study. Assume they classify those with a default probability estimate of at least .5 as Defaulters.  A potential borrower with a credit score of 723 who has been at their current job for 7 years is applying for a loan with payments equaling 11% of their income. Based on this classification tree, the best estimate of the probability that this loan applicant would default would be ________.
(Multiple Choice)
4.8/5 (31)
A cable television company has randomly selected a sample of 222 Basic package customers for a marketing test to see which customers are more likely to upgrade to the Premium package. They monitored two predictor variables based on customer activity during the most recently billed month. Then they included a special upgrade offer for the Premium package along with their bill. The response variable Upgrade equals True if a customer accepted the offer to upgrade to the Premium package and equals False otherwise. The predictor variable ViewTime is the average daily minutes the customer had at least one TV on in their house. Network is 1 if the TV is tuned to a traditional ("over the public airwaves") broadcast network at least 50 percent of the time that it is turned on and 0 otherwise. Let the events U, Uc, HV, and NV denote the events that the randomly selected Basic customer, respectively, upgraded, did not upgrade, had a high ViewTime [a view time greater than the median amount of 507 minutes], and was primarily a traditional broadcast network viewer [i.e., spent at least 50% of time tuned to a traditional network]. The data they collected show: 1) 43 out of 222 Basic customers upgraded, or P(U) = 43/222.
2) 179 out of 222 Basic customers did not upgrade, or P(Uc) = 179/222.
3) 37 out of 43 upgraders had a high ViewTime, or P(HV|U) = 37/43.
4) 63 out of 179 non-upgraders had a high ViewTime, or P(HV|Uc) = 63/179.
"5) 7 out of 43 upgraders was primarily a traditional broadcast network viewer,
Or P(NV|U) = 7/43."
"6) 52 out of 179 non-upgraders was primarily a traditional broadcast network viewer,
Or P(NV|Uc) = 52/179.
How many upgraders were not primarily traditional broadcast network viewers?"
(Multiple Choice)
4.9/5 (33)
Suppose that a bank wishes to predict whether or not an existing holder of its Silver credit card will upgrade, for an annual fee, to its Platinum credit card. To do this, the bank carries out a pilot study that randomly selects 40 of its existing Silver card holders and offers each Silver card holder an upgrade to its Platinum card. Here, the response variable Upgrade equals 1 if the Silver card holder decided to upgrade and 0 otherwise. Moreover, the predictor variable Purchases is last year's purchases (in thousands of dollars) by the Silver card holder, and the predictor variable PlatProfile equals 1 if the Silver card holder conforms to the bank's Platinum profile and 0 otherwise. Below is the classification tree they derived from the data collected in the study.  Based on this classification tree, which of the following Silver card holders would the bank classify as an upgrader (assuming they classify those with an upgrade probability estimate of at least .5 as upgraders)?
(Multiple Choice)
4.9/5 (39)
Filters
- Essay(0)
- Multiple Choice(0)
- Short Answer(0)
- True False(0)
- Matching(0)